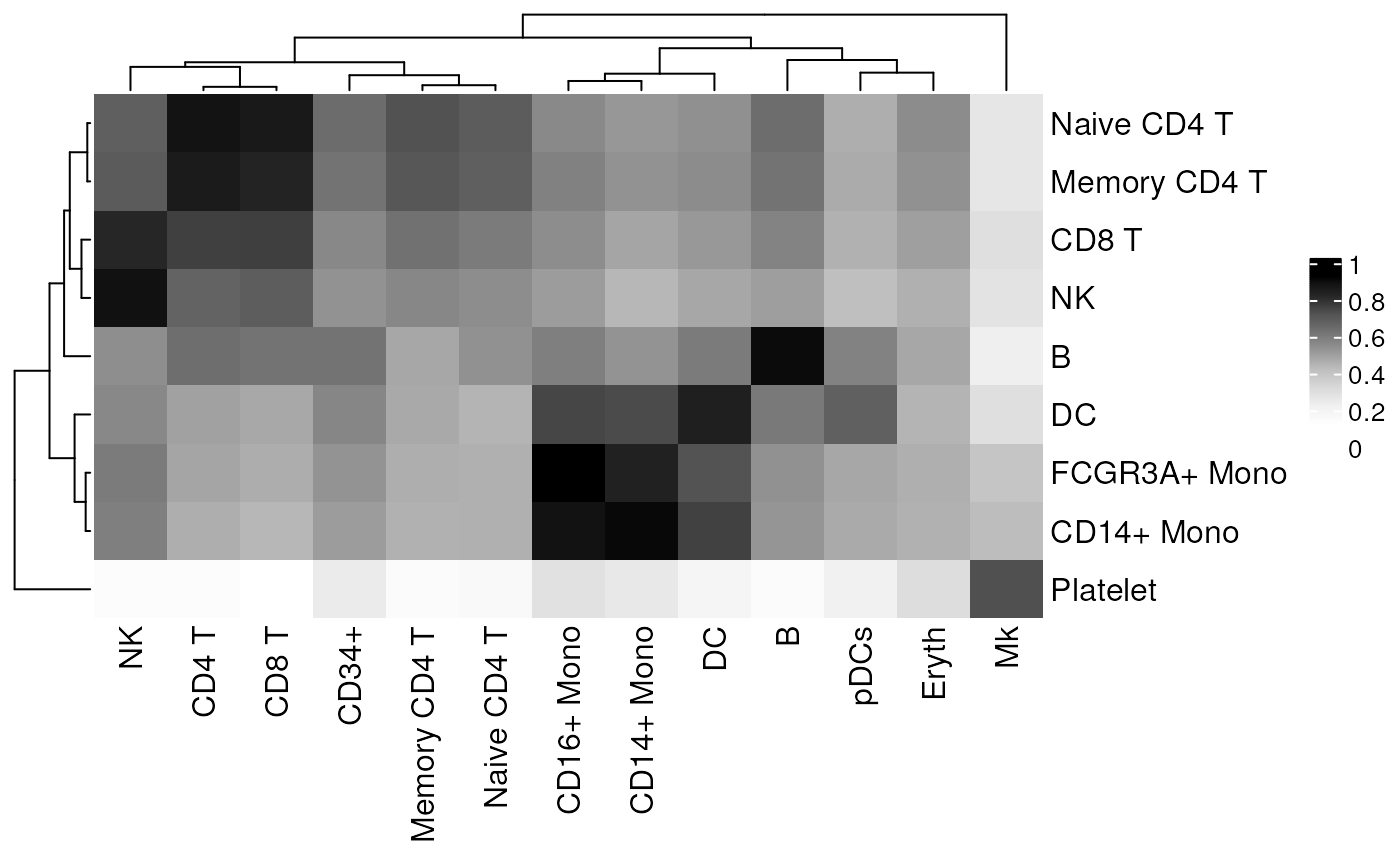
Plot similarity measures on heatmap
Usage
plot_cor_heatmap(
  cor_mat,
  metadata = NULL,
  cluster_col = NULL,
  col = not_pretty_palette,
  legend_title = NULL,
  ...
)
Arguments
- cor_mat
input similarity matrix
- metadata
input metadata with per cell tsne or umap cooordinates and cluster ids
- cluster_col
colname of clustering data in metadata, defaults to rownames of the metadata if not supplied.
- col
color ramp to use
- legend_title
legend title to pass to Heatmap
- ...
passed to Heatmap
Examples
res <- clustify(
    input = pbmc_matrix_small,
    metadata = pbmc_meta,
    ref_mat = cbmc_ref,
    query_genes = pbmc_vargenes,
    cluster_col = "classified",
    per_cell = FALSE
)
#> using # of genes: 599
#> similarity computation completed, matrix of 9 x 13, preparing output

plot_cor_heatmap(res)