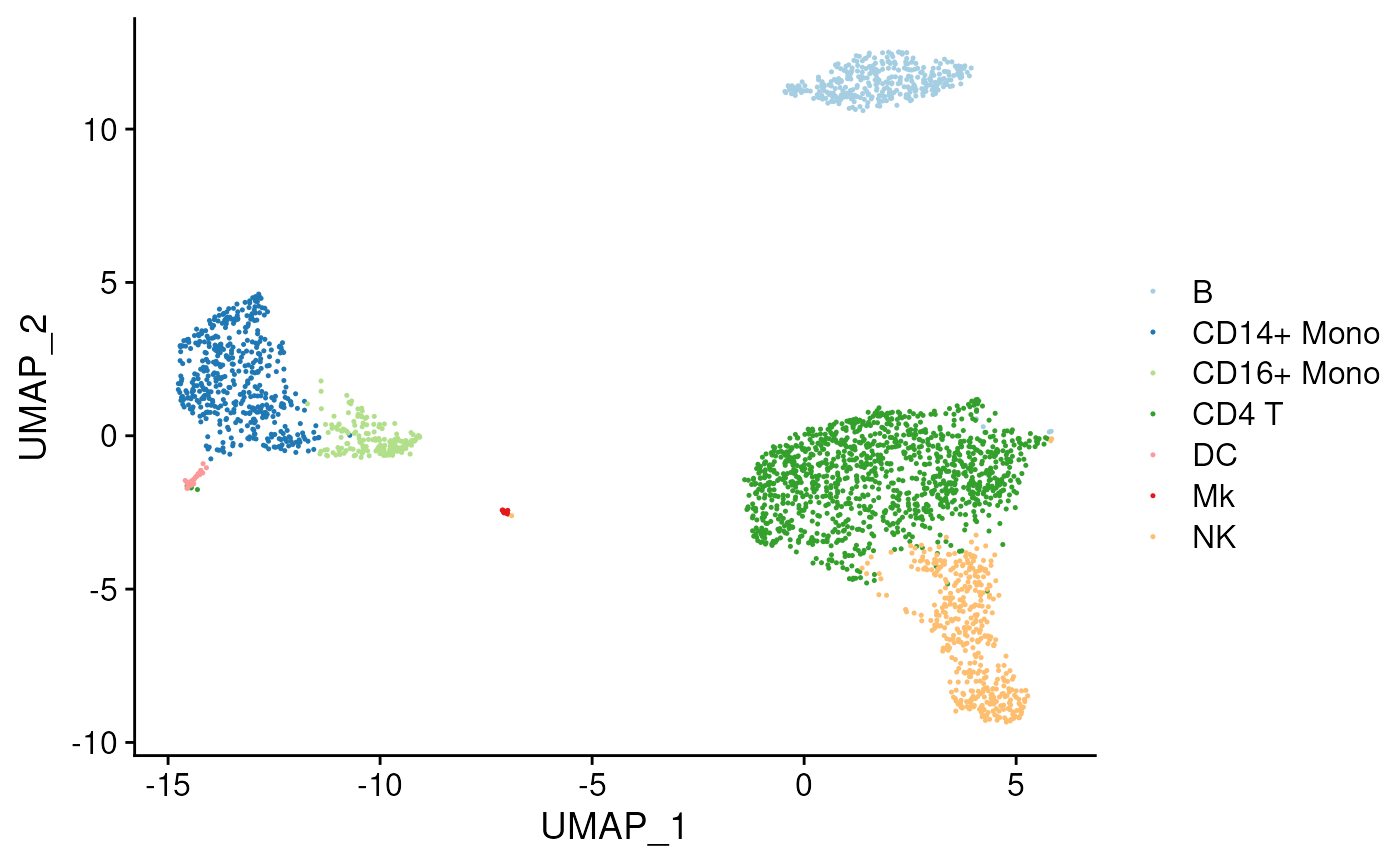
Plot best calls for each cluster on a tSNE or umap
Usage
plot_best_call(
  cor_mat,
  metadata,
  cluster_col = "cluster",
  collapse_to_cluster = FALSE,
  threshold = 0,
  x = "UMAP_1",
  y = "UMAP_2",
  plot_r = FALSE,
  per_cell = FALSE,
  ...
)
Arguments
- cor_mat
input similarity matrix
- metadata
input metadata with tsne or umap coordinates and cluster ids
- cluster_col
metadata column, can be cluster or cellid
- collapse_to_cluster
if a column name is provided, takes the most frequent call of entire cluster to color in plot
- threshold
minimum correlation coefficent cutoff for calling clusters
- x
x variable
- y
y variable
- plot_r
whether to include second plot of cor eff for best call
- per_cell
whether the cor_mat was generate per cell or per cluster
- ...
passed to plot_dims
Examples
res <- clustify(
    input = pbmc_matrix_small,
    metadata = pbmc_meta,
    ref_mat = cbmc_ref,
    query_genes = pbmc_vargenes,
    cluster_col = "classified"
)
#> using # of genes: 599
#> similarity computation completed, matrix of 9 x 13, preparing output

plot_best_call(
    cor_mat = res,
    metadata = pbmc_meta,
    cluster_col = "classified"
)