Mapping chromatin structure and transactions
Interval analysis
bed_intersect() example
First, we’ll define some example intervals in x and y.
Visual representation of the intersecting intervals.
Tibble of the intersecting intervals.
Note the addition of .x and .y suffixes to disamguate the input sources.
read_bed() example
Rse read_bed() to load genome annotations and signals.
You’ll also use read_bedgraph() and read_bigwig() on your problem set.
What is in snps and genes?
Interval manipulation
Let’s find and characterize intergenic SNPs. We’ll use the tools bed_substract() and bed_closest(). Take a look and their examples in the valr documentation to see what they do.
Here, we’ll ask the question: “Which SNPs are intergenic, and how far are they from the nearest gene?”
Take a look at the intergenic and nearby objects in the console.
Interval manipulation
Now that you have overlaps and distances between SNPs and genes, you can go back to dplyr tools to generate reports.
bed_map() example
bed_map() does two things in order:
- It identifies intersecting intervals between
xandy - Calculates summary statistics based on the intersection
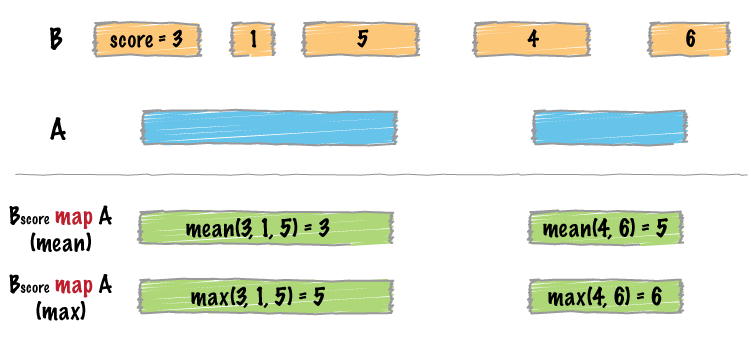
A typical use is to count up signals (e.g., coverage from an MNase-seq experiment) over specific regions (e.g., promoter regions).
bed_map() example
Let’s setup some example data.
bed_map() example continued
First examine the intersecting intervals.
Visual representation of bed_map()
Computing multiple summaries with bed_map()