Plot gene expression on to tSNE or umap
Usage
plot_gene(expr_mat, metadata, genes, cell_col = NULL, ...)
Arguments
- expr_mat
input single cell matrix
- metadata
data.frame with tSNE or umap coordinates
- genes
gene(s) to color tSNE or umap
- cell_col
column name in metadata containing cell ids, defaults
to rownames if not supplied
- ...
additional arguments passed to [clustifyr::plot_dims()]
Value
list of ggplot object, cells projected by dr,
colored by gene expression
Examples
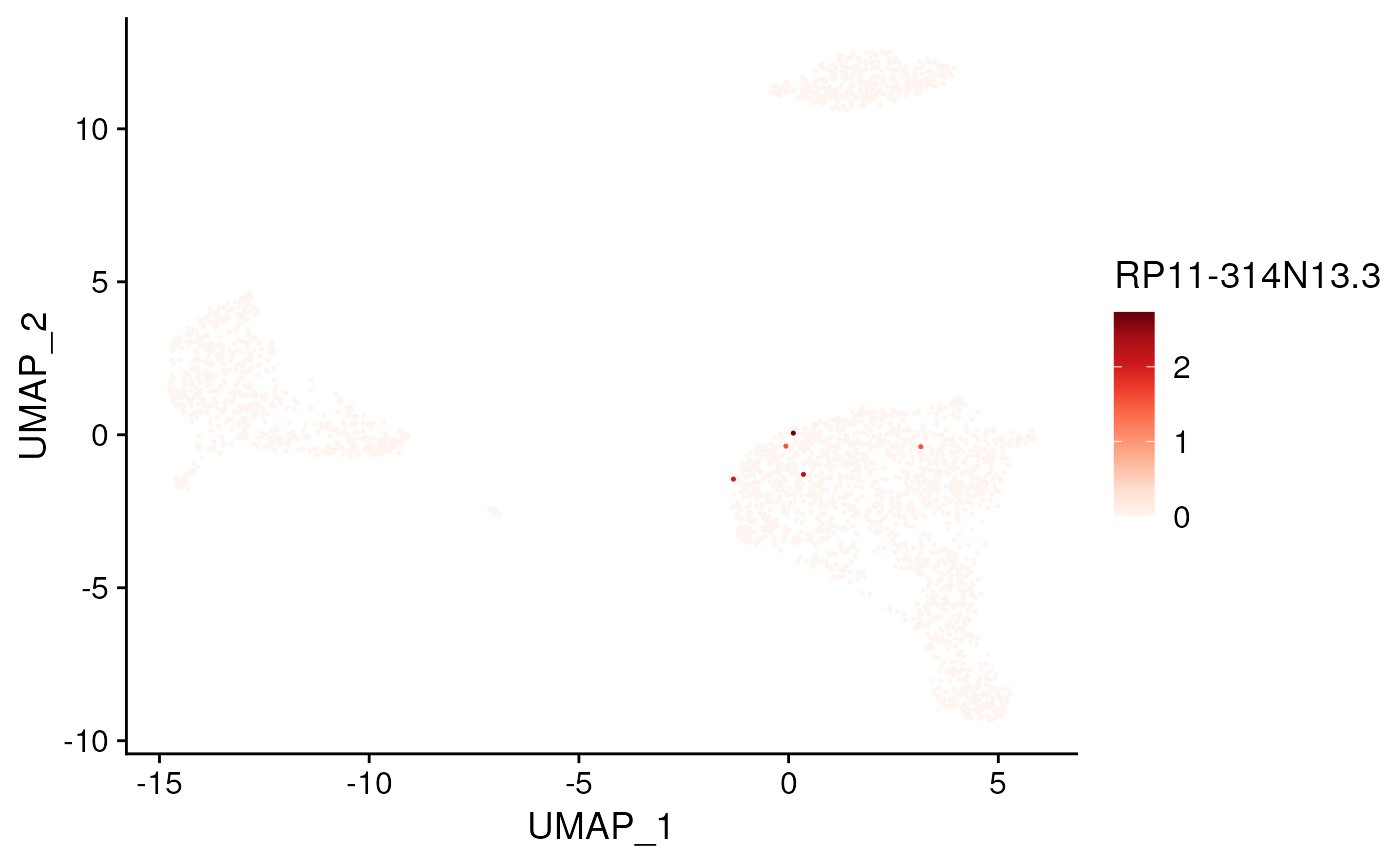
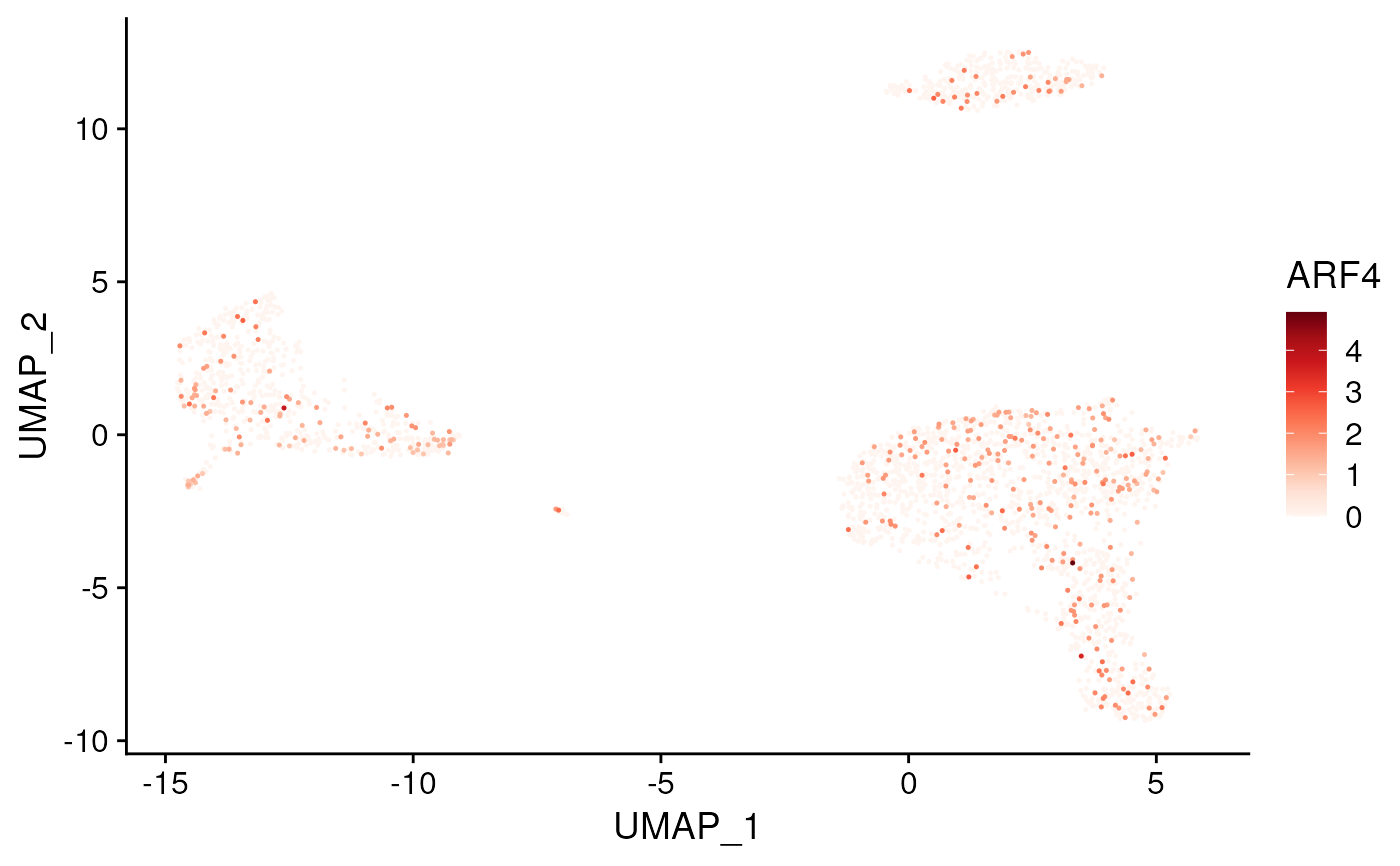
genes <- c(
    "RP11-314N13.3",
    "ARF4"
)

plot_gene(
    expr_mat = pbmc_matrix_small,
    metadata = tibble::rownames_to_column(pbmc_meta, "rn"),
    genes = genes,
    cell_col = "rn"
)
#> [[1]]

#>
#> [[2]]

#>
#> [[2]]
 #>
#>