Plot clonotype abundance
Arguments
- input
Single cell object or data.frame containing V(D)J data. If a data.frame is provided, the cell barcodes should be stored as row names.
- cluster_col
meta.data column containing cluster IDs to use for grouping cells when calculating clonotype abundance. Clonotypes will be plotted separately for each cluster.
- clonotype_col
meta.data column containing clonotype IDs to use for calculating clonotype abundance
- method
Method to use for plotting, 'bar' will generate a bargraph, 'line' will generate a rank-abundance plot.
- units
Units to plot on the y-axis, either 'frequency' or 'percent'
- plot_colors
Character vector containing colors for plotting
- plot_lvls
Character vector containing levels for ordering
- n_clones
Number of top clonotypes to plot (default is 10). If method is set to 'line', this will specify the number of clonotypes to label (default is 3).
- label_aes
Named list providing additional aesthetics (color, size, etc.) for clonotype labels when creating line graph
- panel_nrow
The number of rows to use for arranging plot panels, use this when separate bar graphs are created for each cell cluster
- panel_scales
Should scales for plot panels be fixed or free. This passes a scales specification to ggplot2::facet_wrap, can be 'fixed', 'free', 'free_x', or 'free_y'. 'fixed' will cause panels to share the same scales. Use this when separate bar graphs are created for each cell cluster.
- ...
Additional arguments to pass to ggplot2, e.g. color, fill, size, linetype, etc.
Examples
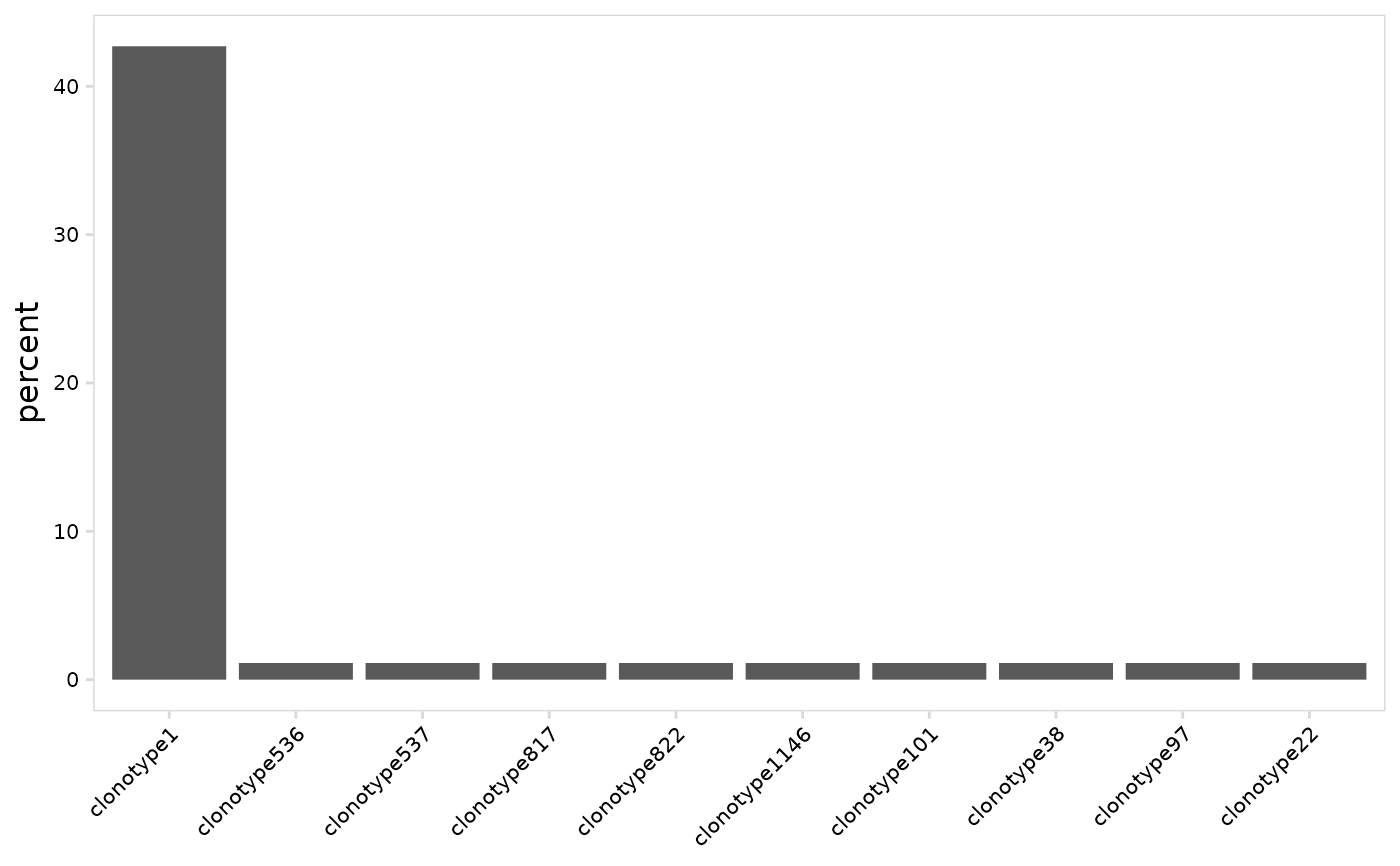
# Plot clonotype abundance using all cells
plot_clonal_abundance(
vdj_so,
data_col = "clonotype_id"
)
#> Warning: Ignoring unknown parameters: `data_col`
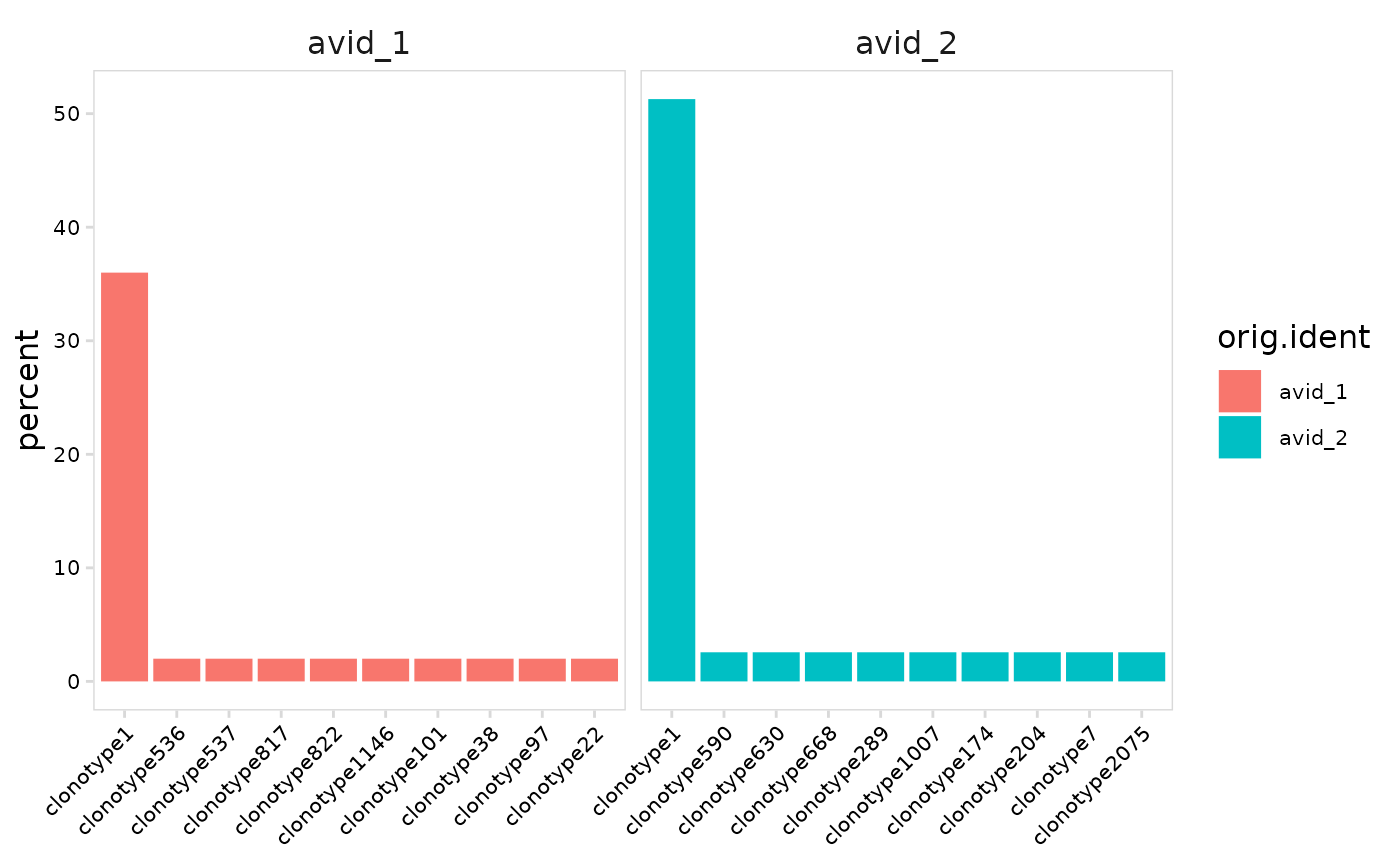
 # Plot clonotype abundance separately for each cell cluster
plot_clonal_abundance(
vdj_sce,
cluster_col = "orig.ident"
)
# Plot clonotype abundance separately for each cell cluster
plot_clonal_abundance(
vdj_sce,
cluster_col = "orig.ident"
)
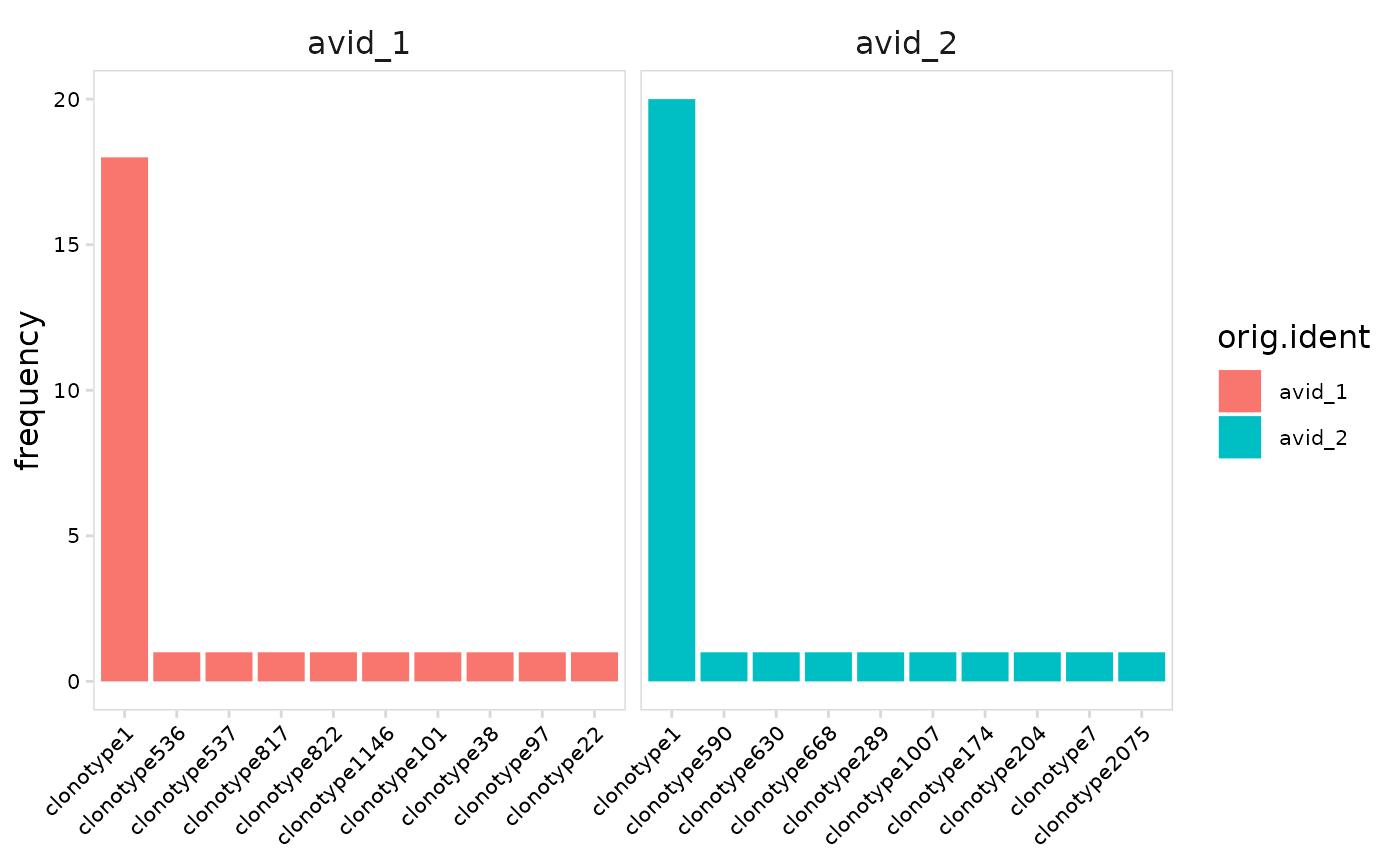
 # Plot the frequency of each clonotype instead of percentage
plot_clonal_abundance(
vdj_sce,
cluster_col = "orig.ident",
units = "frequency"
)
# Plot the frequency of each clonotype instead of percentage
plot_clonal_abundance(
vdj_sce,
cluster_col = "orig.ident",
units = "frequency"
)
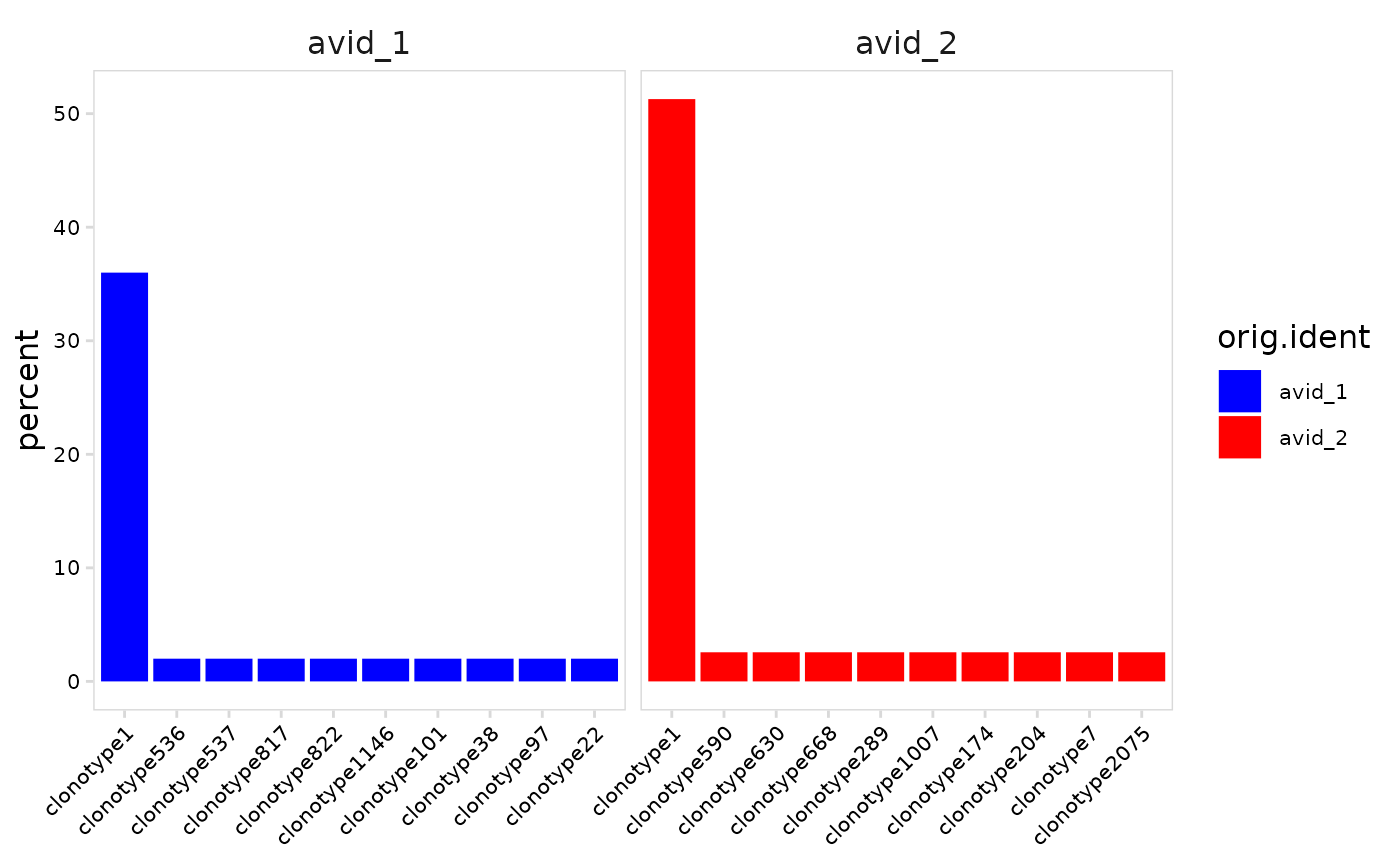
 # Specify colors to use for each cell cluster
plot_clonal_abundance(
vdj_so,
cluster_col = "orig.ident",
plot_colors = c(avid_1 = "blue", avid_2 = "red")
)
# Specify colors to use for each cell cluster
plot_clonal_abundance(
vdj_so,
cluster_col = "orig.ident",
plot_colors = c(avid_1 = "blue", avid_2 = "red")
)
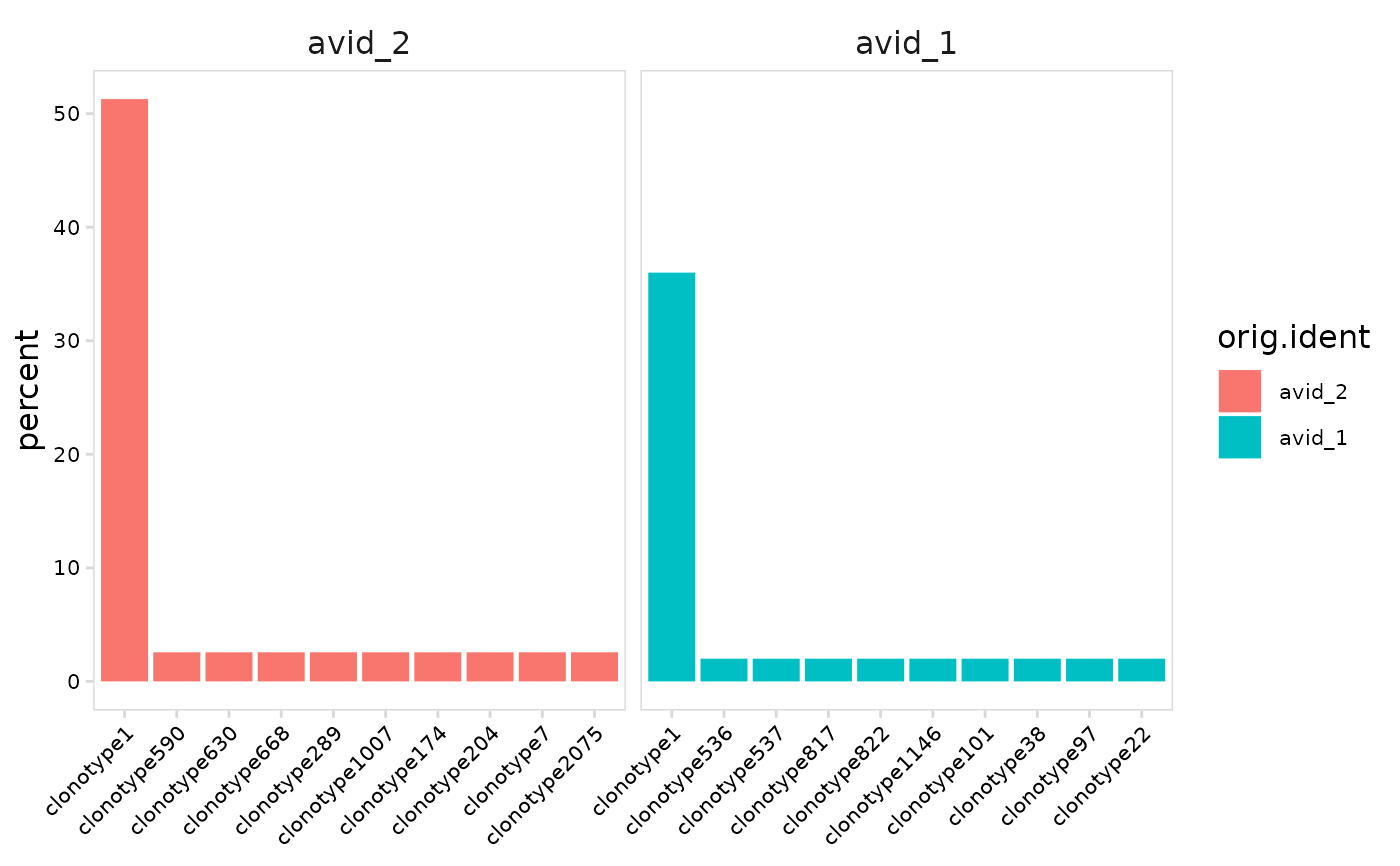
 # Specify order to use for plotting cell clusters
plot_clonal_abundance(
vdj_sce,
cluster_col = "orig.ident",
plot_lvls = c("avid_2", "avid_1")
)
# Specify order to use for plotting cell clusters
plot_clonal_abundance(
vdj_sce,
cluster_col = "orig.ident",
plot_lvls = c("avid_2", "avid_1")
)
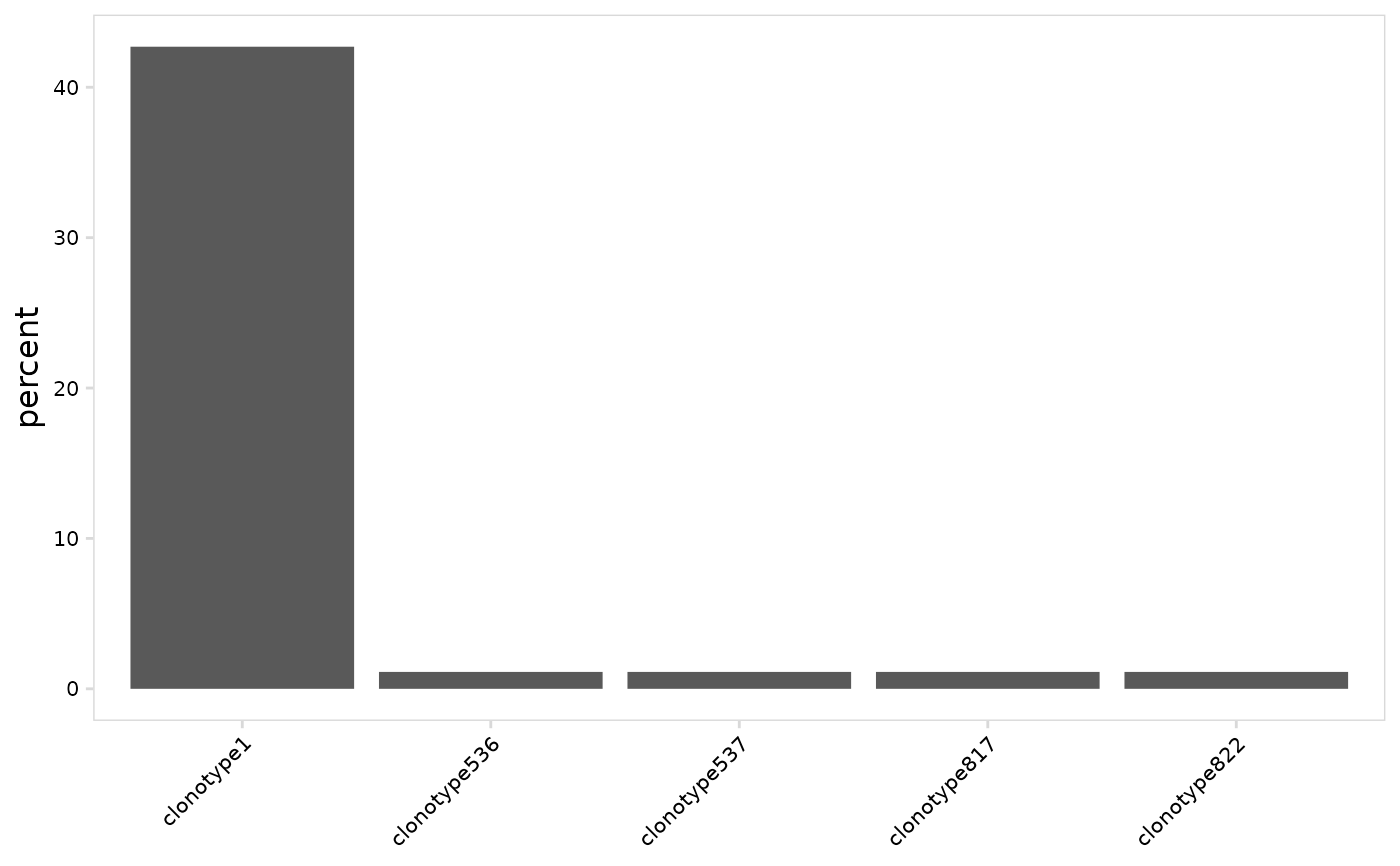
 # Specify the number of top clonotypes to plot
plot_clonal_abundance(
vdj_so,
n_clones = 5
)
# Specify the number of top clonotypes to plot
plot_clonal_abundance(
vdj_so,
n_clones = 5
)
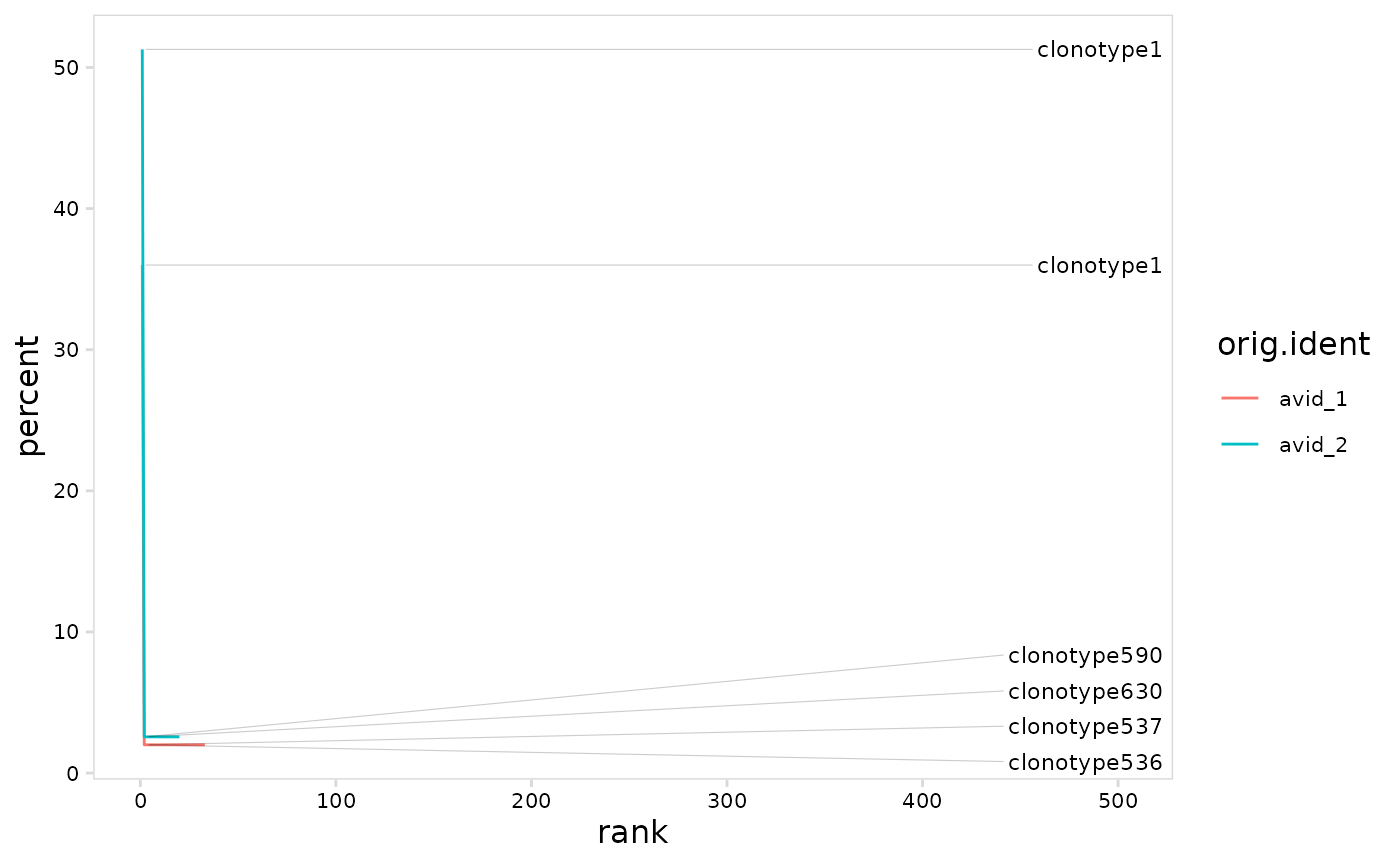
 #' # Create line graph
# use n_clones to set the number of clonotypes to label
plot_clonal_abundance(
vdj_so,
cluster_col = "orig.ident",
method = "line",
n_clones = 3
)
#' # Create line graph
# use n_clones to set the number of clonotypes to label
plot_clonal_abundance(
vdj_so,
cluster_col = "orig.ident",
method = "line",
n_clones = 3
)