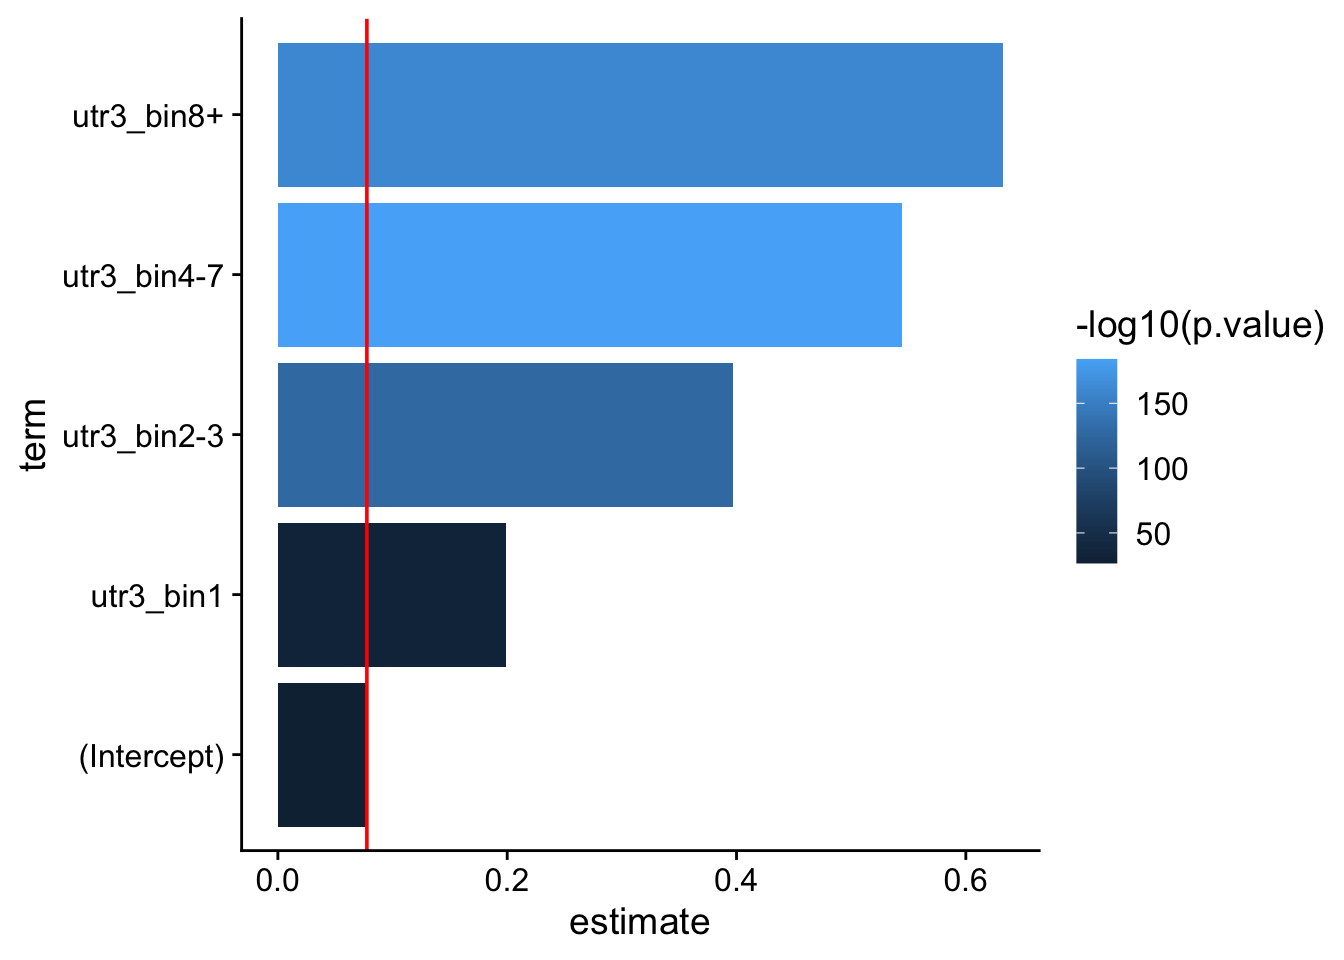
RBP-RNA part 2

Matthew Taliaferro

RNA Bioscience Initiative | CU Anschutz

2026-03-27

mature mRNA regulatory decisions

Just a review of how RBPs control the fate of mRNAs in the cytoplasm.

Mayya and Duchaine

HuR and ARE decay

Remember our analysis of HuR PAR-CLIP data from last class. The model we were testing is that HuR binds to AU-rich elements (ARE) in 3’ UTRs of mRNAs to promote mRNA stability.

Model predictions:

  1. HuR binds to the 3’ UTR and introns.
  2. HuR binds to AU-rich sequences (AUUUA) and U-rich sequences.
  3. HuR binding promotes target RNA stabilization (and binding by the other RBPs to the ARE promotes destabilization).

Set up annotation database

possible_annotations <- builtin_annotations()

# grep to keep those containing "hg19"
hg19_annots <- grep("hg19_genes", possible_annotations, value = T)

# WHY DID WE PICK hg19?

# let's keep 5' utr, cds, intron, 3' utr and intergenic
my_hg19_annots <- hg19_annots[c(3, 4, 7, 10, 11)]

# build the annotation database
annotations <- build_annotations(genome = "hg19", annotations = my_hg19_annots)
'select()' returned 1:1 mapping between keys and
columns
Building promoters...
Building 1to5kb upstream of TSS...
Building intergenic...
Building cds...
Building 5UTRs...
Building 3UTRs...
Building exons...
Building introns...
annotations
GRanges object with 3067854 ranges and 5 metadata columns:
                      seqnames        ranges strand |
                         <Rle>     <IRanges>  <Rle> |
        [1]               chr1   65565-65573      + |
        [2]               chr1   69037-70008      + |
        [3]               chr1 367659-368597      + |
        [4]               chr1 859812-860328      + |
        [5]               chr1 861302-861393      + |
        ...                ...           ...    ... .
  [3067850] chr21_gl383580_alt       1-74652      * |
  [3067851] chr21_gl383581_alt      1-116690      * |
  [3067852] chr22_gl383582_alt      1-162811      * |
  [3067853] chr22_gl383583_alt       1-96924      * |
  [3067854] chr22_kb663609_alt       1-74013      * |
                          id               tx_id
                 <character>         <character>
        [1]            CDS:1 ENST00000641515.2_6
        [2]            CDS:2 ENST00000641515.2_6
        [3]            CDS:3   ENST00000426406.1
        [4]            CDS:4 ENST00000616016.5_7
        [5]            CDS:5 ENST00000616016.5_7
        ...              ...                 ...
  [3067850] intergenic:22783                <NA>
  [3067851] intergenic:22784                <NA>
  [3067852] intergenic:22785                <NA>
  [3067853] intergenic:22786                <NA>
  [3067854] intergenic:22787                <NA>
                gene_id      symbol                  type
            <character> <character>           <character>
        [1]       79501       OR4F5        hg19_genes_cds
        [2]       79501       OR4F5        hg19_genes_cds
        [3]      729759      OR4F29        hg19_genes_cds
        [4]      148398      SAMD11        hg19_genes_cds
        [5]      148398      SAMD11        hg19_genes_cds
        ...         ...         ...                   ...
  [3067850]        <NA>        <NA> hg19_genes_intergenic
  [3067851]        <NA>        <NA> hg19_genes_intergenic
  [3067852]        <NA>        <NA> hg19_genes_intergenic
  [3067853]        <NA>        <NA> hg19_genes_intergenic
  [3067854]        <NA>        <NA> hg19_genes_intergenic
  -------
  seqinfo: 298 sequences (2 circular) from hg19 genome

Annotate PAR-CLIP data

hur_regions <- read_regions(
  con = "https://raw.githubusercontent.com/BIMSBbioinfo/RCAS_meta-analysis/master/rbp-binding-sites/SRR248532.clusters.bed",
  genome = "hg19",
  format = "bed"
)

Attaching package: 'XVector'
The following object is masked from 'package:purrr':

    compact

Attaching package: 'Biostrings'
The following objects are masked from 'package:Hmisc':

    mask, translate
The following object is masked from 'package:base':

    strsplit
# let's annotate
hur_annot <- annotate_regions(
  regions = hur_regions,
  annotations = annotations,
  ignore.strand = FALSE,
  quiet = FALSE
) |>
  data.frame()
Annotating...
# keep only columns we need
myInfo <- c(
  "seqnames",
  "start",
  "end",
  "width",
  "strand",
  "annot.symbol",
  "annot.type"
)

hur_annot <- hur_annot[, myInfo] |>
  unique()

# getting rid of the "hg19_genes_" string to simplify `annot.type`
hur_annot$annot.type <- gsub("hg19_genes_", "", hur_annot$annot.type)

table(hur_annot$annot.type)

     3UTRs      5UTRs        cds intergenic    introns 
     25086        610       1179       6148      85991 

Summarize PAR-CLIP data to gene level

Now we want to get the following info: 1. The # of HuR binding sites per gene. 2. The # of HuR binding sites per region per gene.

# count the # sites per gene and annotation cat
hur_gene_clip <- hur_annot |>
  filter(annot.type != "intergenic") |>
  group_by(annot.symbol, annot.type) |>
  dplyr::count() |>
  pivot_wider(names_from = annot.type, values_from = n)

hur_gene_clip <- hur_gene_clip |>
  mutate_if(is.numeric, replace_na, replace = 0)
`mutate_if()` ignored the following grouping variables:
• Column `annot.symbol`
# new column w/total # sites
hur_gene_clip$total <- rowSums(hur_gene_clip[, -1])

# remove symbols that are NA
hur_gene_clip <- hur_gene_clip |>
  filter(annot.symbol != "NA")

# rename cols
colnames(hur_gene_clip)[1] <- "Symbol"
colnames(hur_gene_clip)[3:4] <- c("utr3", "utr5")

Binding sites per gene

hur_gene_clip_long <- hur_gene_clip |>
  pivot_longer(-Symbol)

colnames(hur_gene_clip_long) <- c("symbol", "region", "sites")

ggplot(
  hur_gene_clip_long |> filter(region != "total"),
  aes(sites, fill = region)
) +
  geom_histogram() +
  scale_x_log10() +
  theme_cowplot()
Warning in scale_x_log10(): log-10 transformation
introduced infinite values.
`stat_bin()` using `bins = 30`. Pick better value
`binwidth`.
Warning: Removed 26048 rows containing non-finite outside the scale
range (`stat_bin()`).

Description of the plot - PLEASE FILL IN

Explore intron vs 3’ UTR sites

# how many genes have both intron and/or 3' UTR sites
site_combo <- hur_gene_clip[, 2:5] |>
  mutate(
    type = case_when(
      introns > 0 & utr3 > 0 ~ "intron_utr3",
      introns > 0 & utr3 == 0 ~ "intron",
      introns == 0 & utr3 > 0 ~ "utr3",
      TRUE ~ "other"
    )
  )

ggplot(site_combo, aes(type)) +
  geom_bar(stat = "count") +
  theme_cowplot()

Description of the plot - PLEASE FILL IN

HuR binds to both introns and 3’ UTRs.

Genes more often have intronic and 3’ UTR binding sites than either alone.

Load HuR knockdown RNA-seq data

  1. primary (unspliced precursor) transcripts in siGFP treated cells.
  2. mature transcripts in siGFP treated cells.
  3. primary (unspliced precursor) transcripts in siHuR treated cells.
  4. mature transcripts in siHuR treated cells.
# load object called HuR.R

# HuR siRNA RNAseq
load(here("data/block-rna/HuR.rds"))


# gene information
gene_info <- read_csv(here("data/block-rna/geneInfo.csv.zip"))
Multiple files in zip: reading 'geneInfo.csv'
Rows: 63568 Columns: 13
── Column specification ────────────────────────────────────
Delimiter: ","
chr (6): Gene, Cat, Annotation, chr, Symbol, strand
dbl (7): row, Exons, Introns, Transcripts, start, end, l...

ℹ Use `spec()` to retrieve the full column specification for this data.
ℹ Specify the column types or set `show_col_types = FALSE` to quiet this message.
HuR$Gene <- rownames(HuR) # new column gene ids

HuR <- left_join(HuR, gene_info[c(2, 11)], by = "Gene") # Symbol

# Filter for expression
hur_filt_rnaseq <- HuR |>
  dplyr::filter(rowMeans(HuR[, 1:4]) > 1) |>
  dplyr::select(-Gene)

integrate siRNA and clip-seq data

# join kd and clip data
kd_clip <- left_join(hur_filt_rnaseq, hur_gene_clip, by = "Symbol")

# convert all NA to 0
kd_clip <- kd_clip |> mutate_if(is.numeric, replace_na, replace = 0)

# calculate log fold changes
kd_clip <- kd_clip |>
  mutate(
    lfc_mature = log2(Mature_siGFP) - log2(Mature_siHuR),
    lfc_primary = log2(Primary_siGFP) - log2(Primary_siHuR)
  )

What is the relationship between HuR binding sites and change expression?

Does HuR promote the stability of its mRNA targets?

Does the number of HuR binding influence the degree of stabilization?

Does the region of HuR binding influence stabilization?

To target or not to target?

# create new column for target or not target

kd_clip$target <- case_when(
  kd_clip$total > 0 ~ "target",
  TRUE ~ "not target"
)


ggplot(kd_clip, aes(lfc_mature, color = target)) +
  stat_ecdf() +
  xlim(-2, 2) +
  theme_cowplot() +
  ylab("cumulative fraction of LFC") +
  ggtitle("HuR Target vs Not Target") +
  geom_hline(yintercept = .75, color = "grey") +
  geom_hline(yintercept = .5, color = "grey") +
  geom_hline(yintercept = .25, color = "grey")
Warning: Removed 247 rows containing non-finite outside the scale
range (`stat_ecdf()`).

Description of the plot - PLEASE FILL IN

To target a little or a lot?

Does the number of HuR binding influence the degree of stabilization?

# hist(kd_clip$utr3)
# let's make bins for # of sites per  3' UTR

kd_clip$utr3_bin <- cut2(x = kd_clip$utr3, c(0, 1, 2, 4, 8, 1000))

# table(kd_clip$utr3_bin)

# let's make bins for UTR
kd_clip$utr3_bin <- recode_factor(
  kd_clip$utr3_bin,
  "   0" = "0",
  "   1" = "1",
  "[   2,   4)" = "2-3",
  "[   4,   8)" = "4-7",
  "[   8,1000]" = "8+"
)


ggplot(data = kd_clip, aes(x = lfc_mature, color = utr3_bin)) +
  stat_ecdf() +
  xlim(-2, 2) +
  theme_cowplot() +
  ylab("cumulative fraction- LFCs") +
  ggtitle("# of HuR binding sites in 3' UTR") +
  geom_hline(yintercept = .75, color = "grey", linetype = "dashed") +
  geom_hline(yintercept = .5, color = "grey", linetype = "dashed") +
  geom_hline(yintercept = .25, color = "grey", linetype = "dashed") +
  geom_segment(
    aes(x = 0, y = 0, xend = 0, yend = .5, colour = "segment"),
    color = "black",
    linetype = "dashed"
  )
Warning in geom_segment(aes(x = 0, y = 0, xend = 0, yend = 0.5, colour = "segment"), : All aesthetics have length 1, but the data has 13465 rows.
ℹ Please consider using `annotate()` or provide this layer
  with data containing a single row.
Warning: Removed 247 rows containing non-finite outside the scale
range (`stat_ecdf()`).

Description of the plot - PLEASE FILL IN

More binding -> more stabilization?

TEST: Does the number of HuR binding influence the degree of stabilization?

# keep only finite values for lfc_mature and lfc_primary
kd_clip_targets <- kd_clip[is.finite(kd_clip$lfc_mature), ]

# IMPORTANT relevel indicating what everything will be compared to
kd_clip_targets$utr3_bin <- relevel(factor(kd_clip_targets$utr3_bin), ref = "0")


# calculate fit using `lm`
fit_bins <- lm(
  data = kd_clip_targets,
  formula = lfc_mature ~ utr3_bin
)

# examine estimates and p-vals
tidy(fit_bins) |>
  gt()
term estimate std.error statistic p.value
(Intercept) 0.0776198 0.007139087 10.87251 2.031031e-27
utr3_bin1 0.1986639 0.016530750 12.01784 4.244574e-33
utr3_bin2-3 0.3971529 0.016361603 24.27347 2.125853e-127
utr3_bin4-7 0.5445475 0.018493174 29.44586 1.081045e-184
utr3_bin8+ 0.6323603 0.023118248 27.35330 2.510227e-160

More binding -> more stabilization?

TEST: Does the number of HuR binding influence the degree of stabilization?

# mean lfc of mRNAs with no 3' UTR binding sites
ref_mean <- kd_clip_targets |>
  filter(utr3_bin == "0") |>
  pull(lfc_mature) |>
  mean()


# examine estimates and p-vals
tidy(fit_bins) |>
  ggplot(
    aes(
      x = term,
      y = estimate,
      fill = -log10(p.value)
    )
  ) +
  geom_bar(stat = "identity") +
  coord_flip() +
  geom_hline(
    yintercept = ref_mean,
    color = "red"
  ) +
  theme_cowplot()