  [1] "T" "H" "H" "T" "H" "T" "T" "T" "H" "H" "T" "T" "T"
 [14] "H" "H" "H" "T" "H" "T" "H" "T" "H" "T" "T" "H" "T"
 [27] "T" "T" "H" "H" "T" "T" "T" "H" "T" "T" "T" "T" "T"
 [40] "T" "H" "T" "H" "T" "H" "H" "T" "H" "H" "T" "T" "T"
 [53] "T" "T" "T" "H" "T" "H" "T" "H" "H" "H" "H" "T" "H"
 [66] "T" "T" "H" "T" "T" "T" "H" "T" "H" "H" "H" "T" "H"
 [79] "T" "H" "H" "T" "H" "H" "H" "T" "H" "T" "H" "H" "T"
[92] "H" "T" "H" "T" "T" "H" "T" "T" "H"Stats Bootcamp - class 10
Stats intro and history
RNA Bioscience Initiative | CU Anschutz
2025-10-20
Learning objective stats-bootcamp
Familiarity with probabilities, distributions, and descriptive statistics
Perform exploratory data analysis
Know which statistical methods are appropriate for your data
Understand and execute different statistical approaches
“You can’t be neutral on a moving train”
Class overview
Motivation for why stats are important
History of stats
Why do we need to know statistics?
As scientists we need to assign confidence to our results.
Convince ourselves
Convince other scientists
Convince the public (additional challenges)
Stats + probability are not intuitive
- See patterns where there are none
- Miss patterns we are NOT expecting
- We tend to be overconfident
- Bad at Bayesian thinking
- Don’t do well with dependencies
- Don’t update expectations with new evidence
See patterns where there are none

Cross-section of female nematode worm Ascaris
Miss existing patterns

ALWAYS visualize your data.
Let’s flip a fair coin
Flip a coin 5 times with equal prob of H or T
Again
Let’s flip an unfair coin
Flip a coin 5 times with equal prob of H or T
Again
Let’s summarize the flipping results
Flip a fair coin 10
Flip a fair coin 10 and calculate mean
Again
Let’s go wild flipping
Flip a fair coin 10 times and calculate mean. Then do 5 rounds of that experiment.
[1] 0.5 0.4 0.5 0.3 0.4Tidy and visualize flips
make a dataframe with means and accompanying info
Selecting by avg# A tibble: 6 × 2
cheating avg
<chr> <dbl>
1 fair 0.5
2 fair 0.4
3 fair 0.5
4 unfair 0.5
5 unfair 0.4
6 fair 0.4plot it
ggplot(allFlips, aes(x = cheating, y = avg, color = cheating)) +
  geom_jitter() +
  stat_summary(
    fun = mean,
    geom = "point",
    shape = 18,
    size = 3,
    color = "grey"
  ) +
  ylim(-0.05, 1.05) +
  geom_hline(yintercept = .5, linetype = "dashed") + # true mean fair
  geom_hline(yintercept = .2, linetype = "dashed") + # true mean unfair
  theme_cowplot()
Play around some more
numFlips <- 50
numRounds <- 5

myFairTosses <- vector()

for (i in 1:numRounds) {
  myFairTosses[i] <- rbinom(n = numFlips, size = 1, prob = .5) |> mean()
}

myUnfairTosses <- vector()

for (i in 1:numRounds) {
  myUnfairTosses[i] <- rbinom(n = numFlips, size = 1, prob = .2) |> mean()
}

tibble(
  fair = myFairTosses,
  unfair = myUnfairTosses
) |>
  pivot_longer(
    cols = c("fair", "unfair"),
    names_to = "cheating",
    values_to = "avg"
  ) |>
  ggplot(aes(x = cheating, y = avg, color = cheating)) +
  geom_jitter() +
  stat_summary(
    fun = mean,
    geom = "point",
    shape = 18,
    size = 3,
    color = "black"
  ) +
  ylim(-0.05, 1.05) +
  geom_hline(yintercept = .5, linetype = "dashed") + # true mean fair
  geom_hline(yintercept = .2, linetype = "dashed") + # true mean unfair
  theme_cowplot()
The Monty Hall Problem
Suppose you’re on a game show, and you’re given the choice of three doors: Behind one door is a car; behind the others, goats. You pick a door, say No. 1, and the host, who knows what’s behind the doors, opens another door, say No. 3, which has a goat. He then says to you, “Do you want to pick door No. 2?” Is it to your advantage to switch your choice? ~ (From Parade magazine’s Ask Marilyn column)
Pick a door, any door

Will you switch?

Switching improves your odds 2x
Say you choose Door #1
| Behind Door 1 |
Behind Door 2 |
Behind Door 3 |
Result if STAY | Result if SWITCH |
|---|---|---|---|---|
| Car | Goat | Goat | Car | Goat |
| Goat | Car | Goat | Goat | Car |
| Goat | Goat | Car | Goat | Car |
Simulation of Monty Hall Problem
# number of times to repeat the experiment
iter <- 1000

# defining the doors
doors <- c("goat", "goat", "car")

# initialize dataframe to store the result per iteration
monte_hall <- function(iteration) {
  # iteration <- 10
  contestant_door <- sample(doors, size = iteration, replace = TRUE)

  i <- 1:iteration

  # stick_win which is equal to 1 if the contestant_door in current i is car, 0 otherwise.
  # switch_win which is equal to 0 if the contestant_door is equal to car, 1 otherwise.
  stick_win <- ifelse(contestant_door == "car", 1, 0)
  switch_win <- ifelse(contestant_door == "car", 0, 1)

  stick_prob <- cumsum(stick_win) / i
  switch_prob <- cumsum(switch_win) / i

  # store result in a tibble
  results <- tibble(
    i = i,
    contestant_door = contestant_door,
    stick_win = stick_win,
    switch_win = switch_win,
    stick_prob = stick_prob,
    switch_prob = switch_prob
  )

  return(results)
}

monte_hall_results <- monte_hall(iter)

ggplot(monte_hall_results, mapping = aes(x = i, y = stick_prob)) +
  geom_line(color = "#3333ff") +
  geom_line(aes(y = switch_prob), color = "#ff751a") +
  ylab("Est.Probability") +
  xlab("Iteration") +
  geom_label(
    data = tibble(
      label = c("switch", "stick"),
      i = c(iter, iter),
      stick_prob = c(0.75, 0.25)
    ),
    aes(label = label),
    show.legend = FALSE
  ) +
  ggtitle("Estimated Probability of Winning") +
  theme_cowplot()
You can’t be neutral on a moving train
Howard Zinn: “To Be Neutral, To Be Passive In A Situation Is To Collaborate With Whatever Is Going On”
Zinn, a prolific writer and scholar, tore down the wall intended to separate activism — or partisanship — from the professed objectivity of scholarship. Instead Zinn told his students that he did not

“pretend to an objectivity that was neither possible nor desirable. ‘You can’t be neutral on a moving train,’ I would tell them...Events are already moving in certain deadly directions, and to be neutral means to accept that.”

Zinn is writing in response to the timeless questions that burn within anyone who cares about creating a more just society and world. Is change possible? Where will it come from? Can we actually make a difference? How do you remain hopeful?
Modern Statistics, Beer, and Eugenics

“Eugenics is broadly defined as the use of selective breeding to improve the human race.”

Fathers of statistics


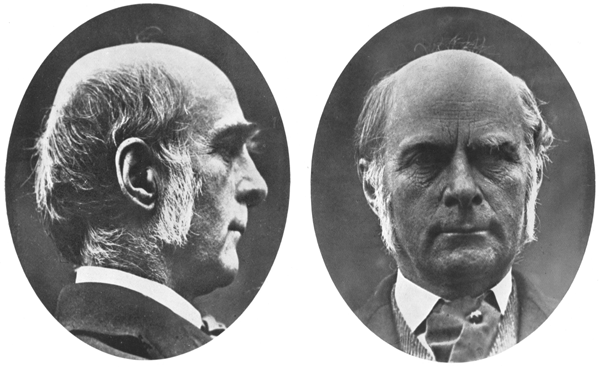
- Sir Francis Galton (1822-1911)
- Karl Pearson (1857-1936)
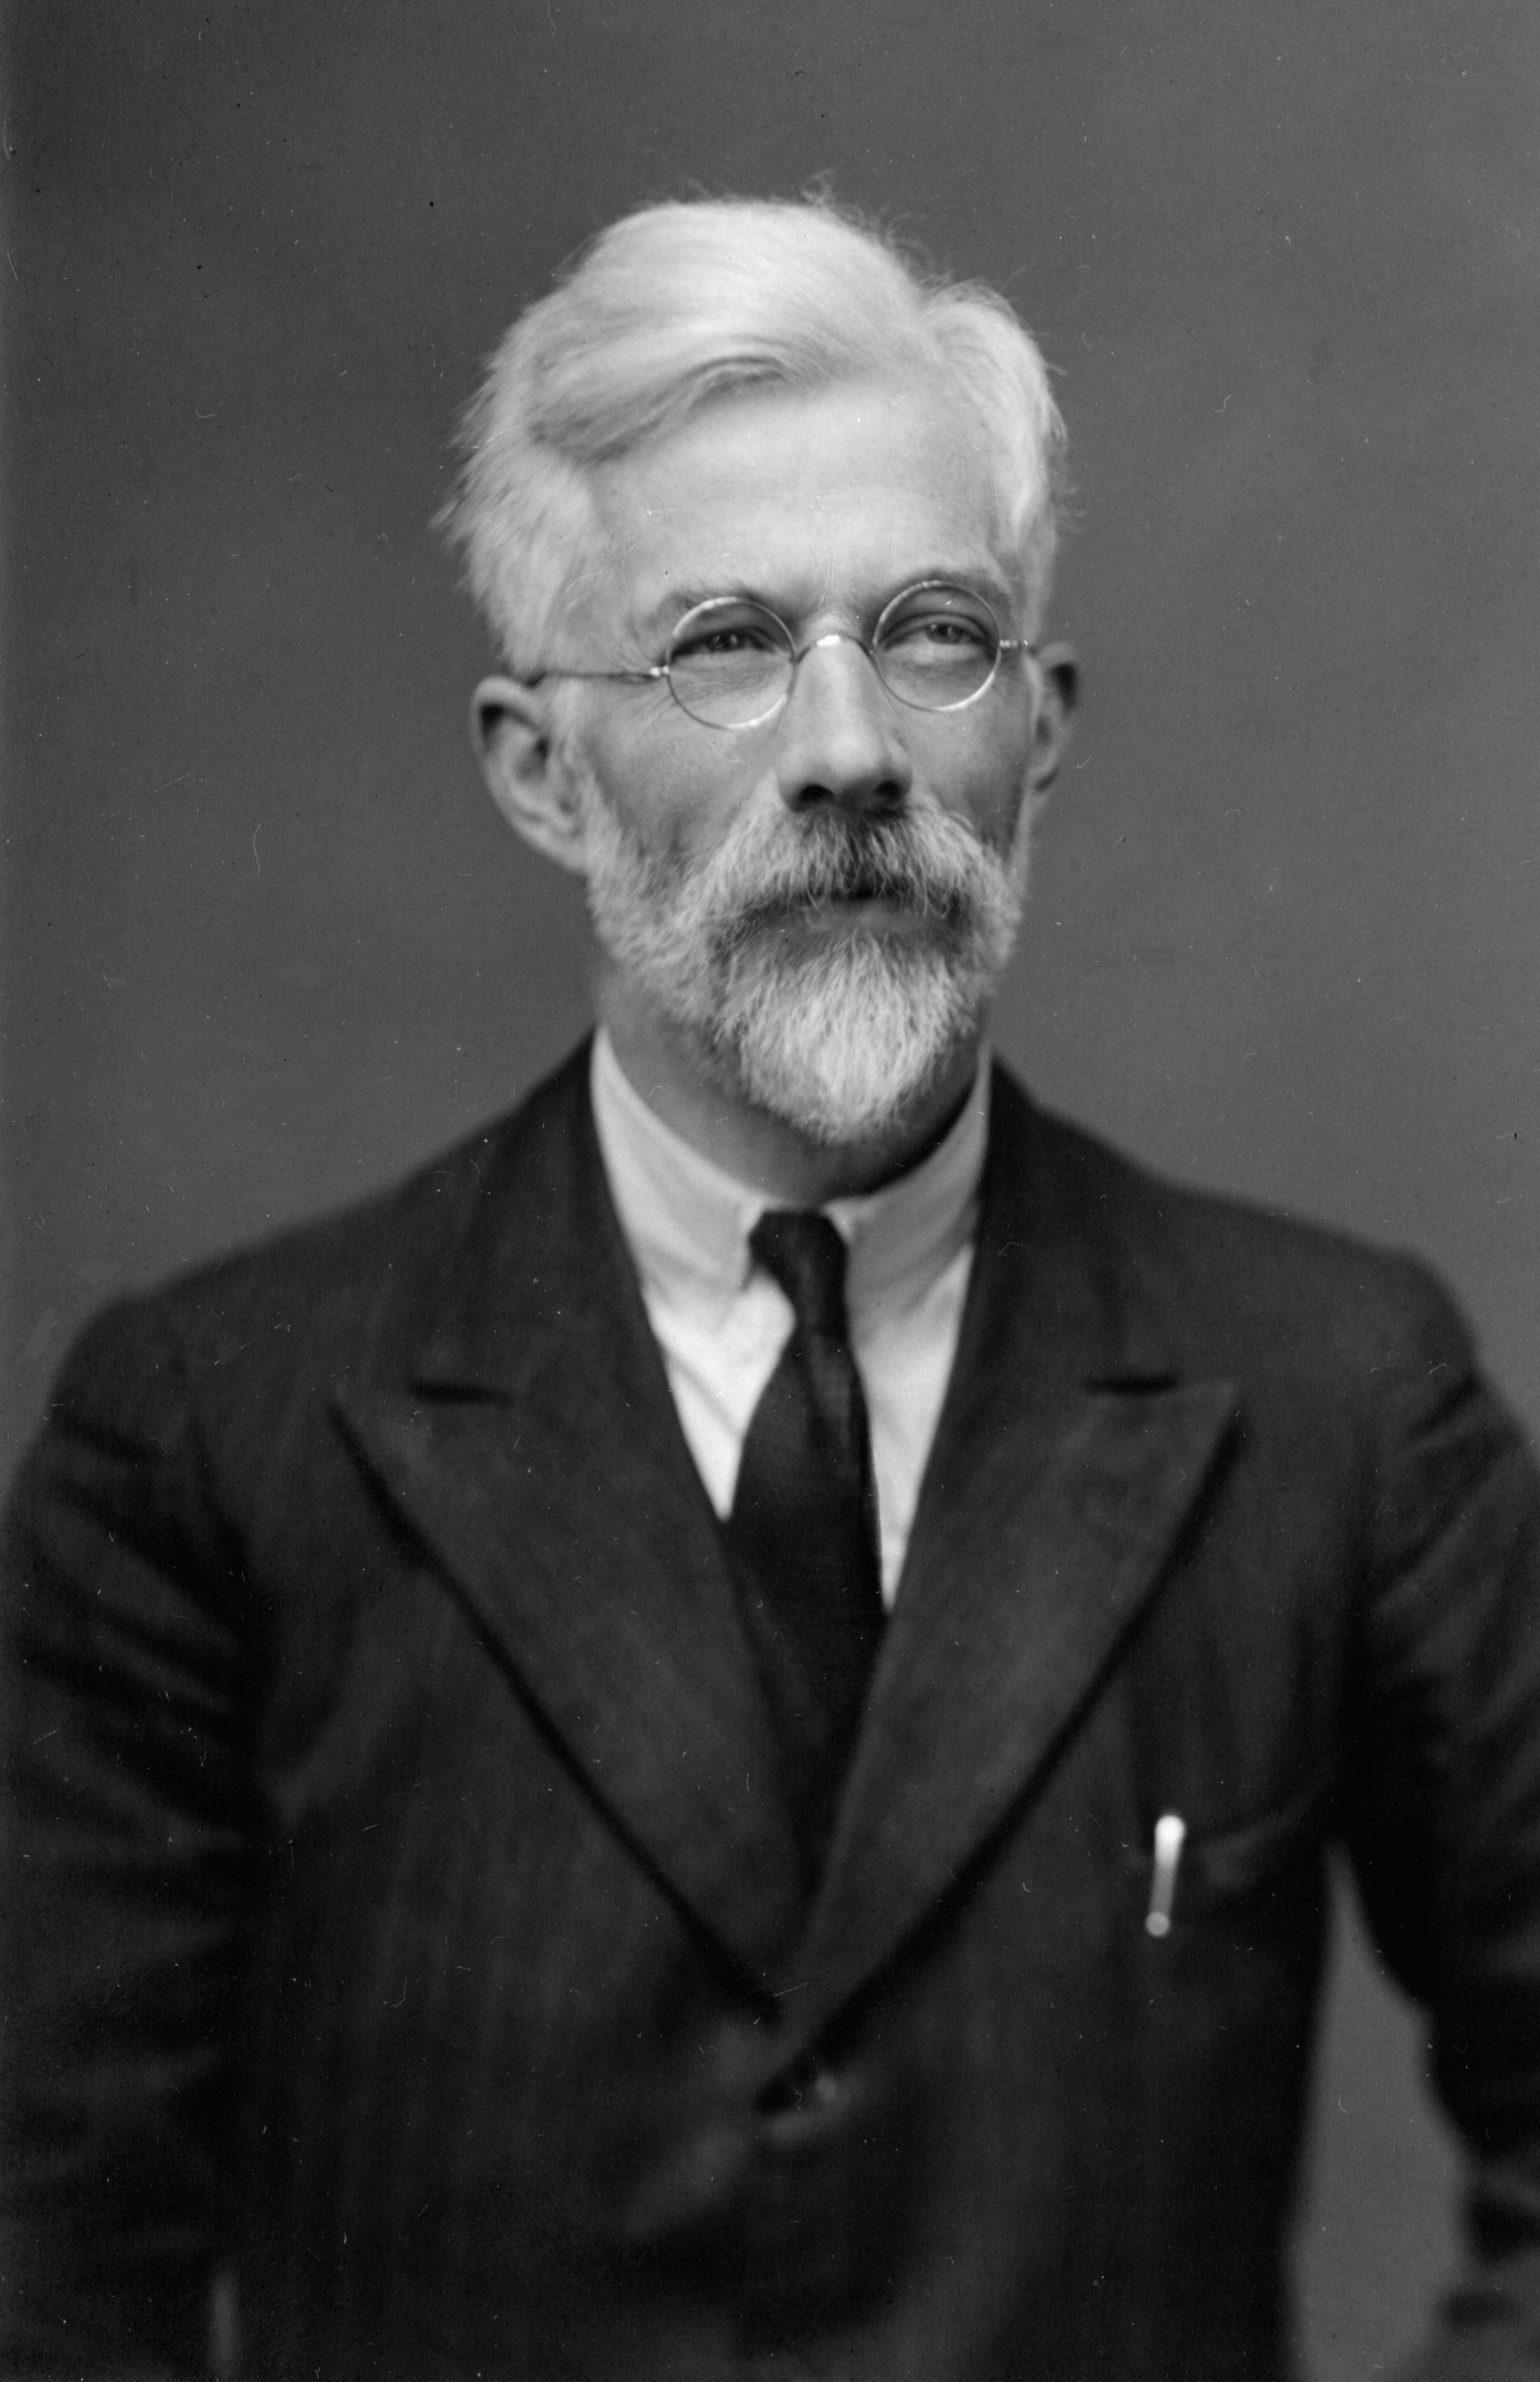
- Sir Ronald Aylmer Fisher (1890-1962)
Sir Francis Galton (1822-1911)
Discovered regression to the mean
Re-discovered correlation and regression and discovered how to apply these in anthropology, psychology, and more
Defined the concept of standard deviation
Established the field of Eugenics in 1883
Darwin’s cousin.
Galton’s reasoning for coining the term eugenics:
“We greatly want a brief word to express the science of improving stock, which…takes cognisance of all influences that tend in however remote a degree to give the more suitable races or strains of blood a better chance of prevailing speedily over the less suitable than they otherwise would have had.”
Karl Pearson (1857-1936)
Pearson was Galton’s protege and developed/contributed to:
Developed hypothesis testing
Developed the use of p-values
Defined the Chi-Squared test
Correlation coefficient
Principle components analysis
Pearson authored of timeless “classics” such as:
Pearson, eugenics, and anti-semitism
In the year Mein Kampf was published, Pearson wrote an article called:
THE PROBLEM OF ALIEN IMMIGRATION INTO GREAT BRITAIN, ILLUSTRATED BY AN EXAMINATION OF RUSSIAN AND POLISH JEWISH CHILDREN
“[they] will develop into a parasitic race…Taken on the average, and regarding both sexes, this alien Jewish population is somewhat inferior physically and mentally to the native population.”
Sir Ronald Aylmer Fisher (1890-1962)
Fisher’s work established many important methods of statistical inference.
The iris dataset
Establishing p = 0.05 as the normal threshold for significant p-values
Promoting Maximum Likelihood Estimation
Developing the ANalysis Of VAriance (ANOVA)
The Genetical Theory of Natural Selection, which blended the work of Mendel and Darwin.
Fisher and eugenics
There is no lack of Fisher’s strong and consistent support for eugenics. Here is an example from as late as 1954.

Letter from R.A. Fisher to R. Ruggles Gates. Ronald Fisher Archive. University of Adelaide.
Storytime, pt I
Galton founded the Eugenics Record Office (1904)
Galton Eugenics Laboratory within University College London (UCL). Created by Pearson and funded by Galton. (1907)
Galton left UCL enough money to create a Chair in National Eugenics, filled by Pearson and then Fisher.
Annals of Human Genetics was established in 1925 Pearson as the Annals of Eugenics, and obtained its current name in 1954.
Galton laboratory was incorporated into the Department of Eugenics, Biometry and Genetic at UCL in 1944.
Storytime, cont.
Renamed to the Department of Human Genetics and Biometry in 1966.
Became part of the Department of Biology at UCL in 1996.
In 2020: UCL renames three facilities that honoured prominent eugenicists
These views did not appear to be common at UCL in the 1930s. For example, they were not held by JBS Haldane, Egon Pearson (son of Karl), and Lionel Penrose.
What about in the US?
U.S. Scientists’ Role in the Eugenics Movement (1907–1939): A Contemporary Biologist’s Perspective
Charles Davenport (first director of CSHL) and the Carnegie Insitution
Government policy

from “America’s Shameful History of Eugenics and Forced Sterilizations”
Modern day: Eugenics and beyond
Sordid genealogies: a conjectural history of Cambridge Analytica’s eugenic roots
The 5 “races”

‘Race’ cannot be biologically defined due to genetic variation among human individuals and populations. (A) The old concept of the “five races:” African, Asian, European, Native American, and Oceanian. (B) Actual genetic variation in humans.
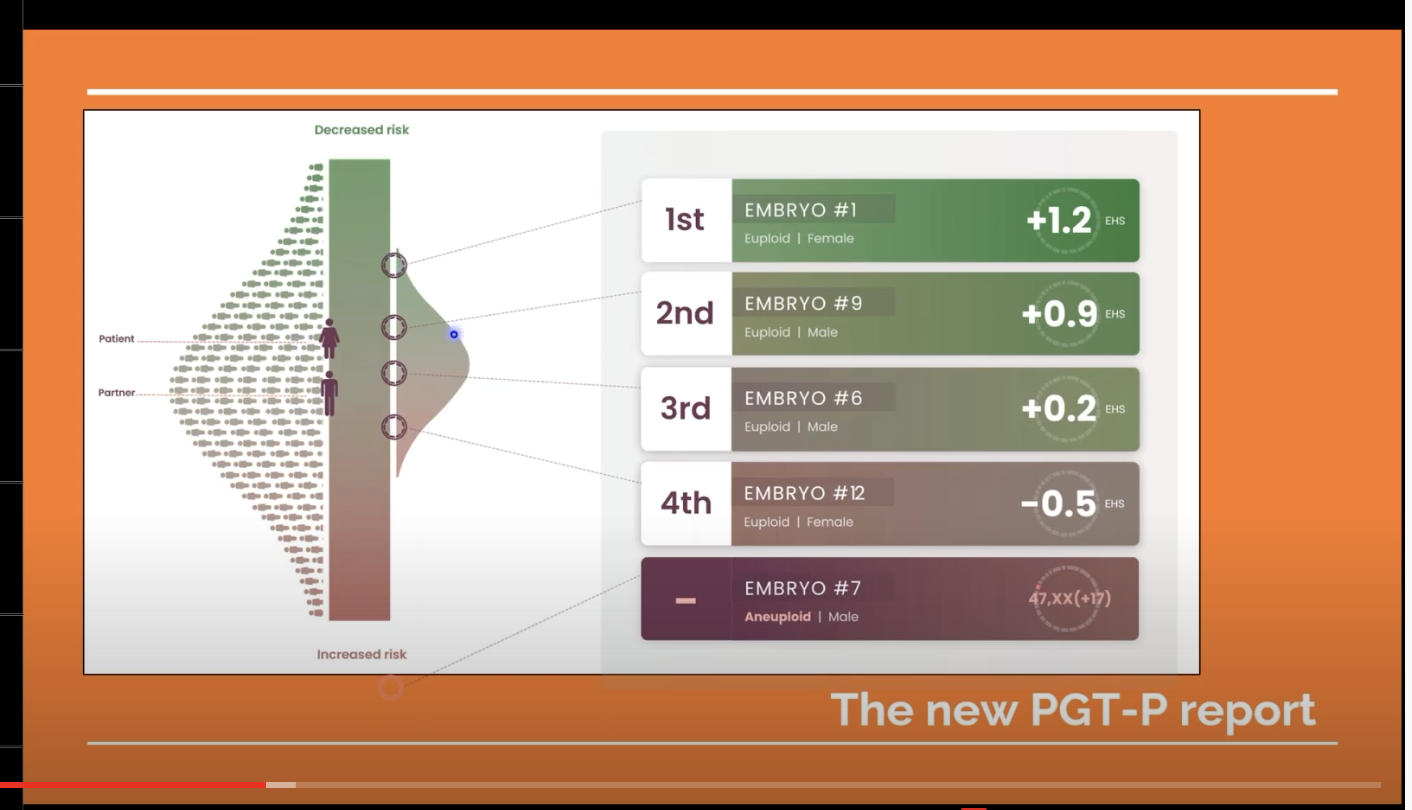
Polygenic Traits, Human Embryos, and Eugenic Dreams
An academic study debunked the idea of “Screening Human Embryos for Polygenic Traits,” but the CEO of the company Stephen Hsu cofounded announced that they had screened human embryos for polygenic traits.

Superior: The Return of Race Science
_cover.jpeg)
https://en.wikipedia.org/wiki/Superior:_The_Return_of_Race_Science
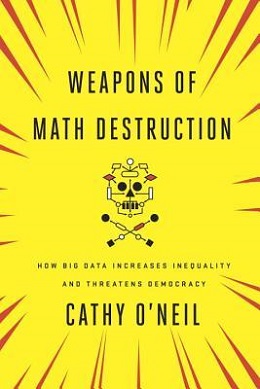
Weapons of Math Destruction

https://en.wikipedia.org/wiki/Weapons_of_Math_Destruction
Just a product of their time
From: Statistics, Eugenics, and Me
Sitting idly by as this happens will make us ‘a product of their time’. This is not good enough. Data Science needs more regulation. Doctors have the Hippocratic Oath, why don’t we have the Nightingale Oath: “Manipulate no data nor results. Promote ethical uses of statistics. Only train models you understand. Don’t promote Eugenics”.References
Eugenics – journey to the dark side at the dawn of statistics
Francis Galton’s Statistical Ideas: The Influence of Eugenics
Sordid genealogies: a conjectural history of Cambridge Analytica’s eugenic roots
U.S. Scientists’ Role in the Eugenics Movement (1907–1939): A Contemporary Biologist’s Perspective
Berlin Wild—and the Max Delbrück Center for Molecular Medicine
Ronald Fisher Is Not Being ‘Cancelled’, But His Eugenic Advocacy Should Have Consequences