[1] "/Users/jayhesselberth/devel/rnabioco/molb-7950/data/syllabus.tsv"R Bootcamp - Day 2
Tidy data & tidyr
Matthew Taliaferro
RNA Bioscience Initiative | CU Anschutz
2026-04-14
Class 2 outline
- Become familiar with “tidyverse” suite of packages
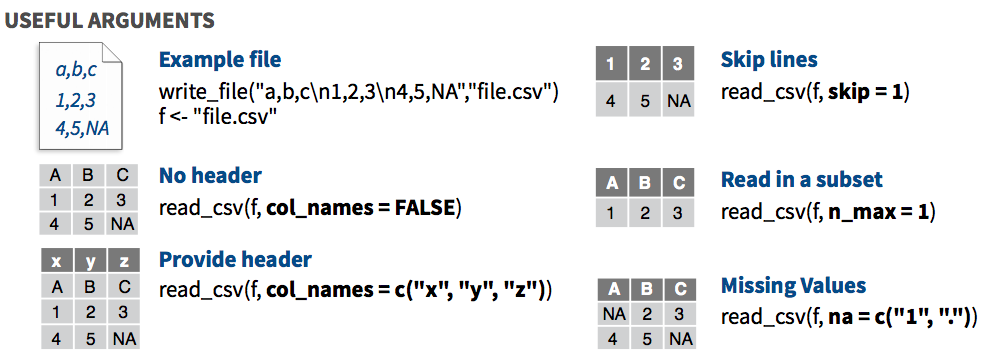
- Introduce readr (Exercise 1)
- Introduce tidyr (Exercise 2)
- Tools for data exploration (Exercises 3-5)
- Learn tidyr functions:
- pivot_wider (Exercise 6)
- pivot_longer (Exercise 7)
- separate (Exercise 8 & 9)
- unite (Exercise 10)
- handling missing values
Tidying exercises
Data import with readr
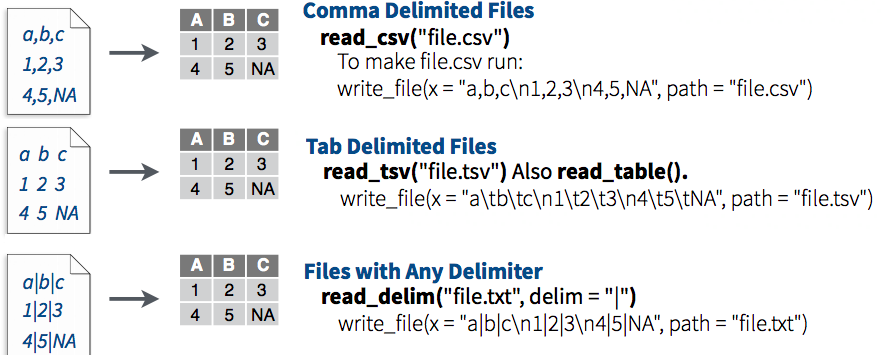
N.B. note the difference between readr::read_csv() and the built-in read.csv(). Use the former.
finding files in a project with here
The here packages makes it easy to reference files in an R project.
Paths identified by here() can be fed to e.g. read_* functions.
Rows: 35 Columns: 6
── Column specification ────────────────────────────────────
Delimiter: "\t"
chr  (5): block, topic, instructor, location, title
dttm (1): date

ℹ Use `spec()` to retrieve the full column specification for this data.
ℹ Specify the column types or set `show_col_types = FALSE` to quiet this message.
# A tibble: 35 × 6
date block topic instructor location title
<dttm> <chr> <chr> <chr> <chr> <chr>
1 2025-08-25 00:00:00 Boot… R Hesselber… AHSB 22… Intr…
2 2025-08-26 00:00:00 Boot… R Hesselber… AHSB 22… Tidy…
3 2025-08-27 00:00:00 Boot… R Hesselber… AHSB 22… dplyr
4 2025-08-28 00:00:00 Boot… R Hesselber… AHSB 22… ggpl…
5 2025-08-29 00:00:00 Boot… R Hesselber… AHSB 22… ggpl…
6 2025-09-01 00:00:00 <NA> <NA> <NA> <NA> NO C…
7 2025-09-02 00:00:00 Boot… R Hesselber… AHSB 22… tidy…
8 2025-09-03 00:00:00 Boot… R Hesselber… AHSB 22… putt…
9 2025-09-04 00:00:00 Boot… R Hesselber… AHSB 22… putt…
10 2025-09-05 00:00:00 Boot… Stat… Mukherjee AHSB 22… Stat…
# ℹ 25 more rowsData sets for tidying - Exercise 2
In this class, we will use the data sets that come with the tidyr package to explore all the functions provided by tidyr.
table1,table2,table3,table4a,table4b, andtable5all display the number of TB cases documented by the World Health Organization in Afghanistan, Brazil, and China between 1999 and 2000.Let’s take a look at these data sets.
Getting familiar with the data - Exercise 3
R provides many functions to examine features of data:
View(): To open the table up in an excel-like interface - not recommended for large tablesclass(): what kind of object is it (high-level)?typeof(): what is an object data type (low-level)?is_tibble(): useisfunctions to query data typestr(): what is the structure of the object?attributes(): does it have any metadata?
Let’s use these to explore table1
Getting familiar with the data - Exercise 4
Useful functions for tibbles:
head()- shows first 6 rowstail()- shows last 6 rowsdim()- returns the dimensions of data frame (i.e. number of rows and number of columns)nrow()- number of rowsncol()- number of columnsnames()orcolnames()- both show the names attribute for a data frameglimpse()
Use these on table1
Exercise 5 - summary, hist, & table
summary(): A generic function used to produce result summaries of the results of various model fitting functions.
country year cases
Length:6 Min. :1999 Min. : 745
Class :character 1st Qu.:1999 1st Qu.: 11434
Mode :character Median :2000 Median : 59112
Mean :2000 Mean : 91277
3rd Qu.:2000 3rd Qu.:179316
Max. :2000 Max. :213766
population
Min. :1.999e+07
1st Qu.:5.845e+07
Median :1.733e+08
Mean :4.901e+08
3rd Qu.:9.983e+08
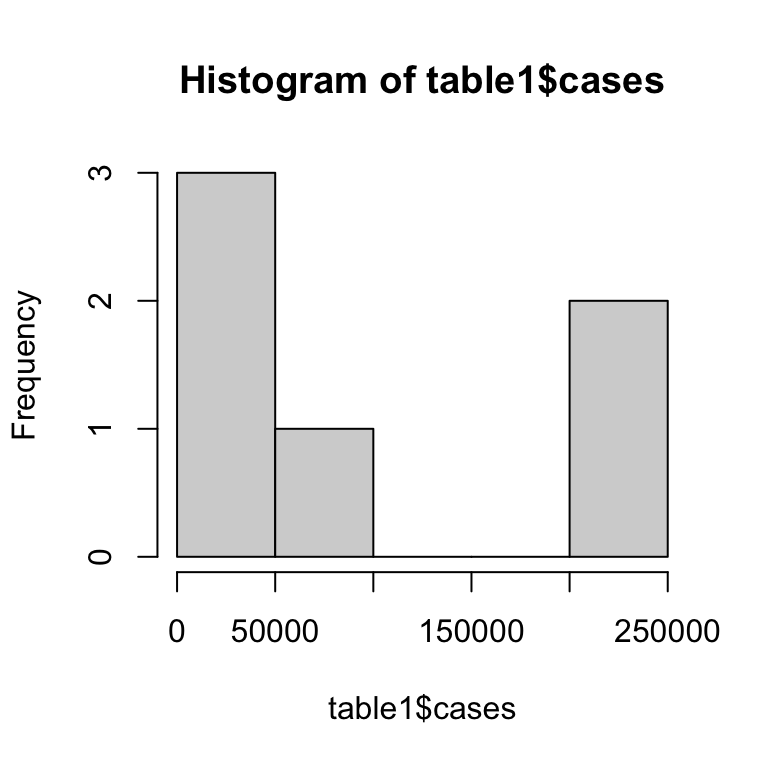
Max. :1.280e+09 you can also summarize one variable, e.g. summary(table1$cases)
hist(): takes a vector and plots a histogram.
table(): uses classifying factors to build a contingency table of the counts for each factor combination.
Tidying data
The four verbs (functions) to keep in mind for reshaping data with tidyr are:
pivot_wider()pivot_longer()separate()unite()
There are other verbs as well - look at the tidyr cheatsheet!
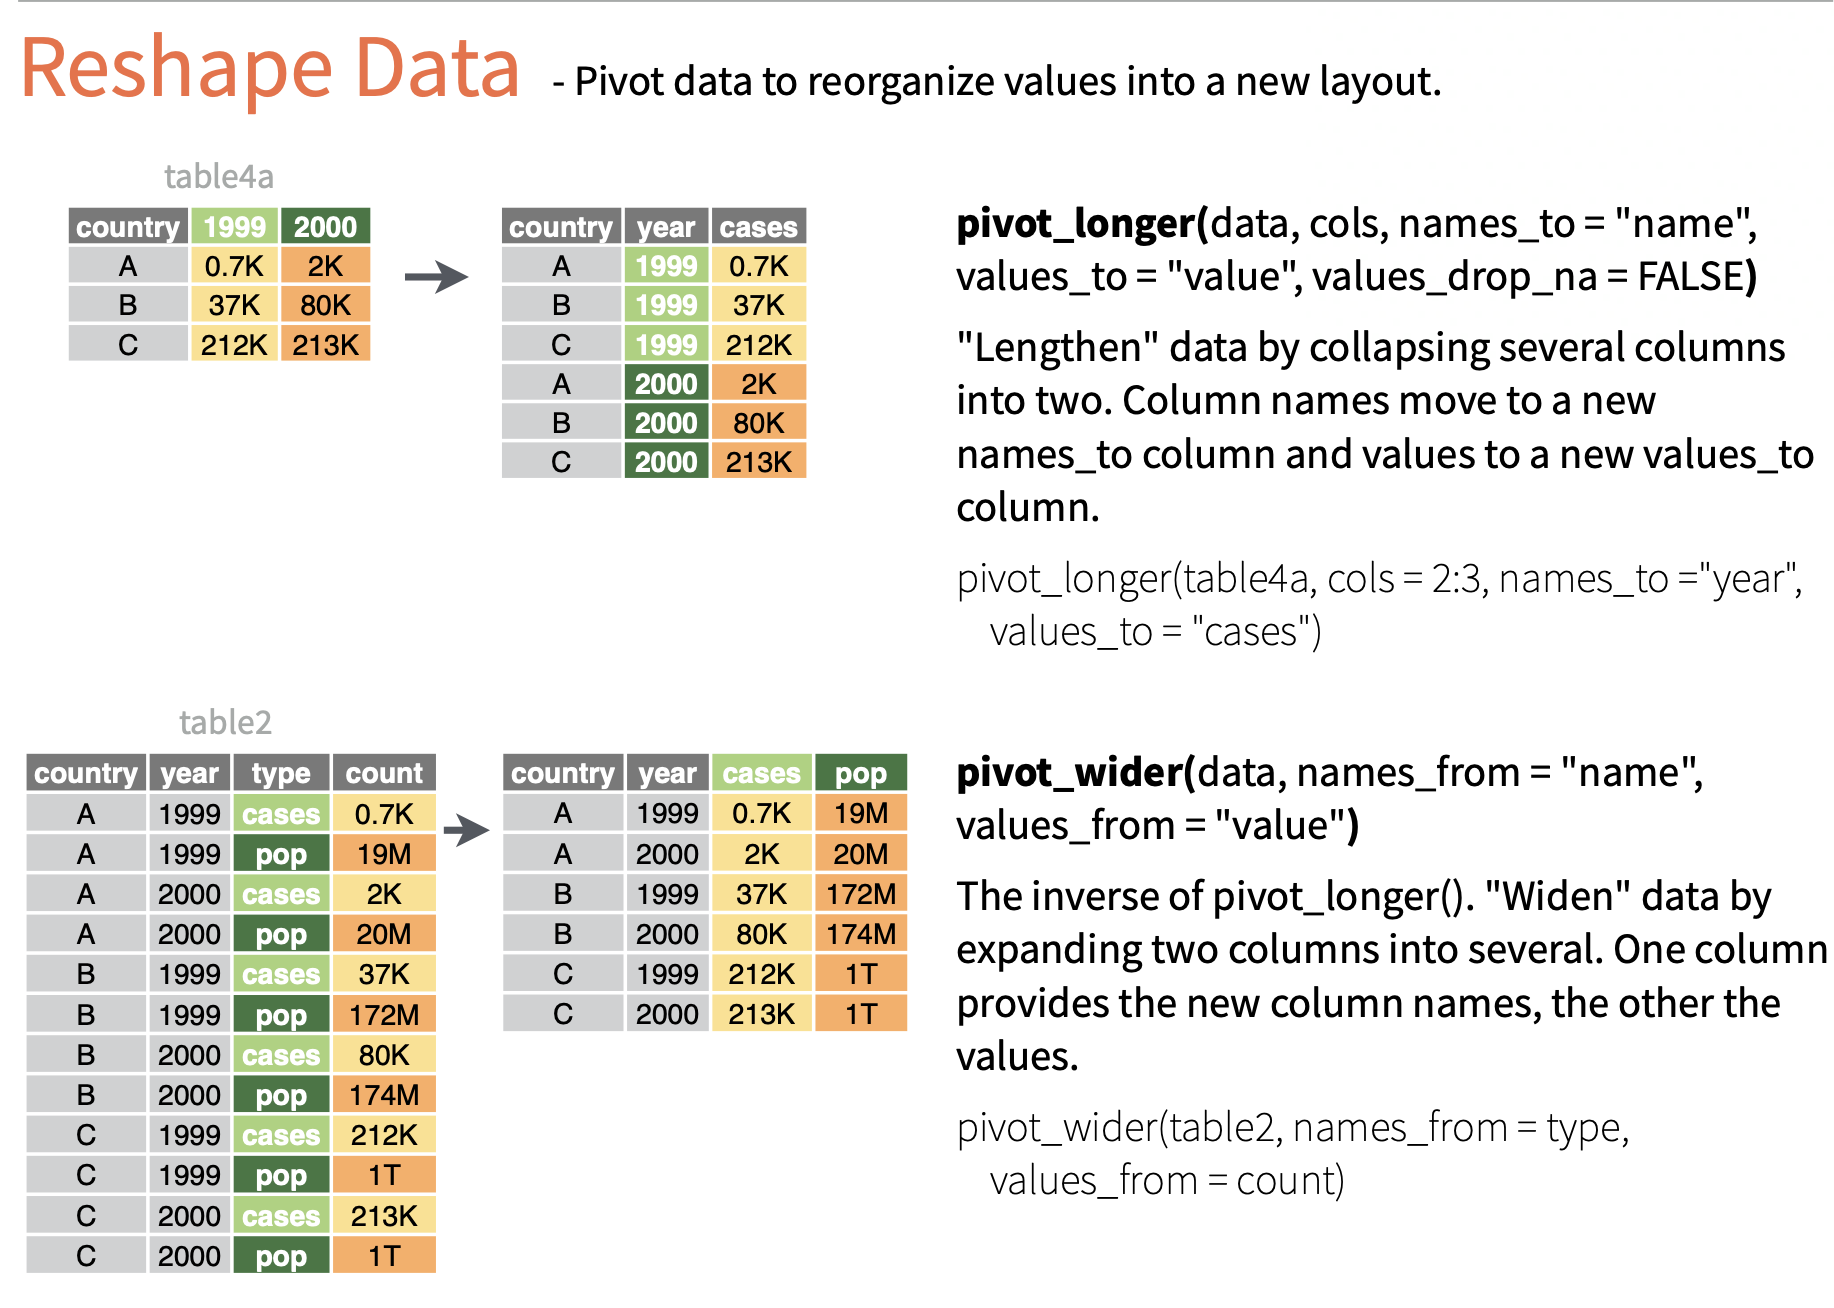
pivot function - visualized
 ::: aside tidyexplain from @gadenbuie :::
pivot_wider() “widens” data, increasing the number of columns and decreasing the number of rows.
Is the left tibble tidy?
pivot_wider() - Exercise 6
What will the output look like?
# A tibble: 12 × 4
   country      year type            count
   <chr>       <dbl> <chr>           <dbl>
 1 Afghanistan  1999 cases             745
 2 Afghanistan  1999 population   19987071
 3 Afghanistan  2000 cases            2666
 4 Afghanistan  2000 population   20595360
 5 Brazil       1999 cases           37737
 6 Brazil       1999 population  172006362
 7 Brazil       2000 cases           80488
 8 Brazil       2000 population  174504898
 9 China        1999 cases          212258
10 China        1999 population 1272915272
11 China        2000 cases          213766
12 China 2000 population 1280428583# A tibble: 6 × 4
country year cases population
<chr> <dbl> <dbl> <dbl>
1 Afghanistan 1999 745 19987071
2 Afghanistan 2000 2666 20595360
3 Brazil 1999 37737 172006362
4 Brazil 2000 80488 174504898
5 China 1999 212258 1272915272
6 China 2000 213766 1280428583If you want to save the output, assign it to a new variable. This new variable will appear in your Environment tab.
# A tibble: 6 × 4
  country      year  cases population
  <chr>       <dbl>  <dbl>      <dbl>
1 Afghanistan  1999    745   19987071
2 Afghanistan  2000   2666   20595360
3 Brazil       1999  37737  172006362
4 Brazil       2000  80488  174504898
5 China        1999 212258 1272915272
6 China 2000 213766 1280428583pivot_longer() “lengthens” data, increasing the number of rows and decreasing the number of columns.
Is the left tibble tidy?
pivot_longer() - Exercise 7
What will the output look like?
# A tibble: 3 × 3
  country     `1999` `2000`
  <chr>        <dbl>  <dbl>
1 Afghanistan    745   2666
2 Brazil       37737  80488
3 China 212258 213766# A tibble: 6 × 3
country year cases
<chr> <chr> <dbl>
1 Afghanistan 1999 745
2 Afghanistan 2000 2666
3 Brazil 1999 37737
4 Brazil 2000 80488
5 China 1999 212258
6 China 2000 213766separate - syntax
Given either a regular expression or a vector of character positions, separate() turns a single character column into multiple columns.
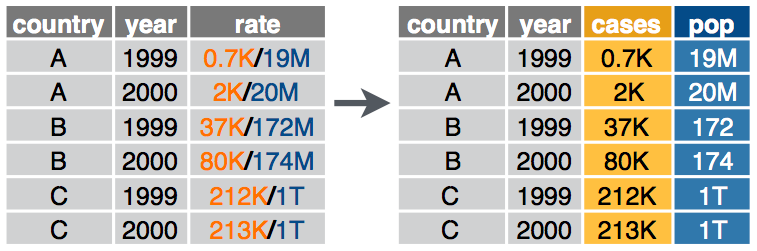
separate_wider_delim() - Exercise 8
What will the output look like?
# A tibble: 6 × 3
  country      year rate
  <chr>       <dbl> <chr>
1 Afghanistan  1999 745/19987071
2 Afghanistan  2000 2666/20595360
3 Brazil       1999 37737/172006362
4 Brazil       2000 80488/174504898
5 China        1999 212258/1272915272
6 China 2000 213766/1280428583# A tibble: 6 × 4
country year cases population
<chr> <dbl> <chr> <chr>
1 Afghanistan 1999 745 19987071
2 Afghanistan 2000 2666 20595360
3 Brazil 1999 37737 172006362
4 Brazil 2000 80488 174504898
5 China 1999 212258 1272915272
6 China 2000 213766 1280428583unite() - syntax
unite() combines multiple columns into a single column.
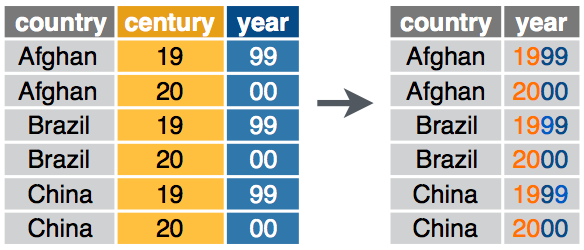
unite() syntax
unite - Exercise 9
Handling missing values
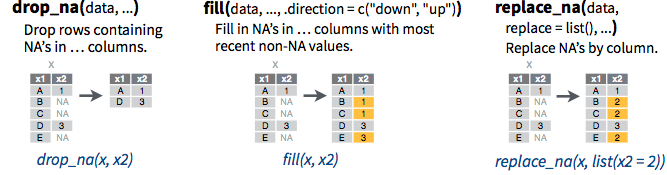
Handling missing values
# A tibble: 3 × 2
      x y
  <dbl> <chr>
1     1 a
2     2 <NA>
3    NA b