# Read in table
psis <- read.table(here("data/block-rna/rMATS/MXE.MATS.JC.txt.gz"), header = T) %>%
# Get rid of columns we aren't really going to use.
dplyr::select(., c("ID", "geneSymbol", "IJC_SAMPLE_1", "SJC_SAMPLE_1", "IJC_SAMPLE_2", "SJC_SAMPLE_2", "FDR", "IncLevel1", "IncLevel2", "IncLevelDifference"))
# Split the replicate read counts that are separated by commas into different columns
psis <- psis %>%
separate(., col = IJC_SAMPLE_1, into = c("IJC_S1R1", "IJC_S1R2", "IJC_S1R3", "IJC_S1R4"), sep = ",", remove = T, convert = T) %>%
separate(., col = SJC_SAMPLE_1, into = c("SJC_S1R1", "SJC_S1R2", "SJC_S1R3", "SJC_S1R4"), sep = ",", remove = T, convert = T) %>%
separate(., col = IJC_SAMPLE_2, into = c("IJC_S2R1", "IJC_S2R2", "IJC_S2R3", "IJC_S2R4"), sep = ",", remove = T, convert = T) %>%
separate(., col = SJC_SAMPLE_2, into = c("SJC_S2R1", "SJC_S2R2", "SJC_S2R3", "SJC_S2R4"), sep = ",", remove = T, convert = T)
# filter events (reads >= 10)
thresh <- 10
psis_filt <- psis %>%
mutate(., S1R1counts = IJC_S1R1 + SJC_S1R1) %>%
mutate(., S1R2counts = IJC_S1R2 + SJC_S1R2) %>%
mutate(., S1R3counts = IJC_S1R3 + SJC_S1R3) %>%
mutate(., S1R4counts = IJC_S1R4 + SJC_S1R4) %>%
mutate(., S2R1counts = IJC_S2R1 + SJC_S2R1) %>%
mutate(., S2R2counts = IJC_S2R2 + SJC_S2R2) %>%
mutate(., S2R3counts = IJC_S2R3 + SJC_S2R3) %>%
mutate(., S2R4counts = IJC_S2R4 + SJC_S2R4) %>%
filter(., S1R1counts >= thresh & S1R2counts >= thresh & S1R3counts >= thresh & S1R4counts >= thresh &
S2R1counts >= thresh & S2R2counts >= thresh & S2R3counts >= thresh & S2R4counts >= thresh)
# Separate the inclusion levels for each sample and replicte (you will need this later)
psis_filt_psi <- psis_filt %>%
separate(., col = IncLevel1, into = c("PSI_S1R1", "PSI_S1R2", "PSI_S1R3", "PSI_S1R4"), sep = ",", remove = T, convert = T) %>%
separate(., col = IncLevel2, into = c("PSI_S2R1", "PSI_S2R2", "PSI_S2R3", "PSI_S2R4"), sep = ",", remove = T, convert = T)
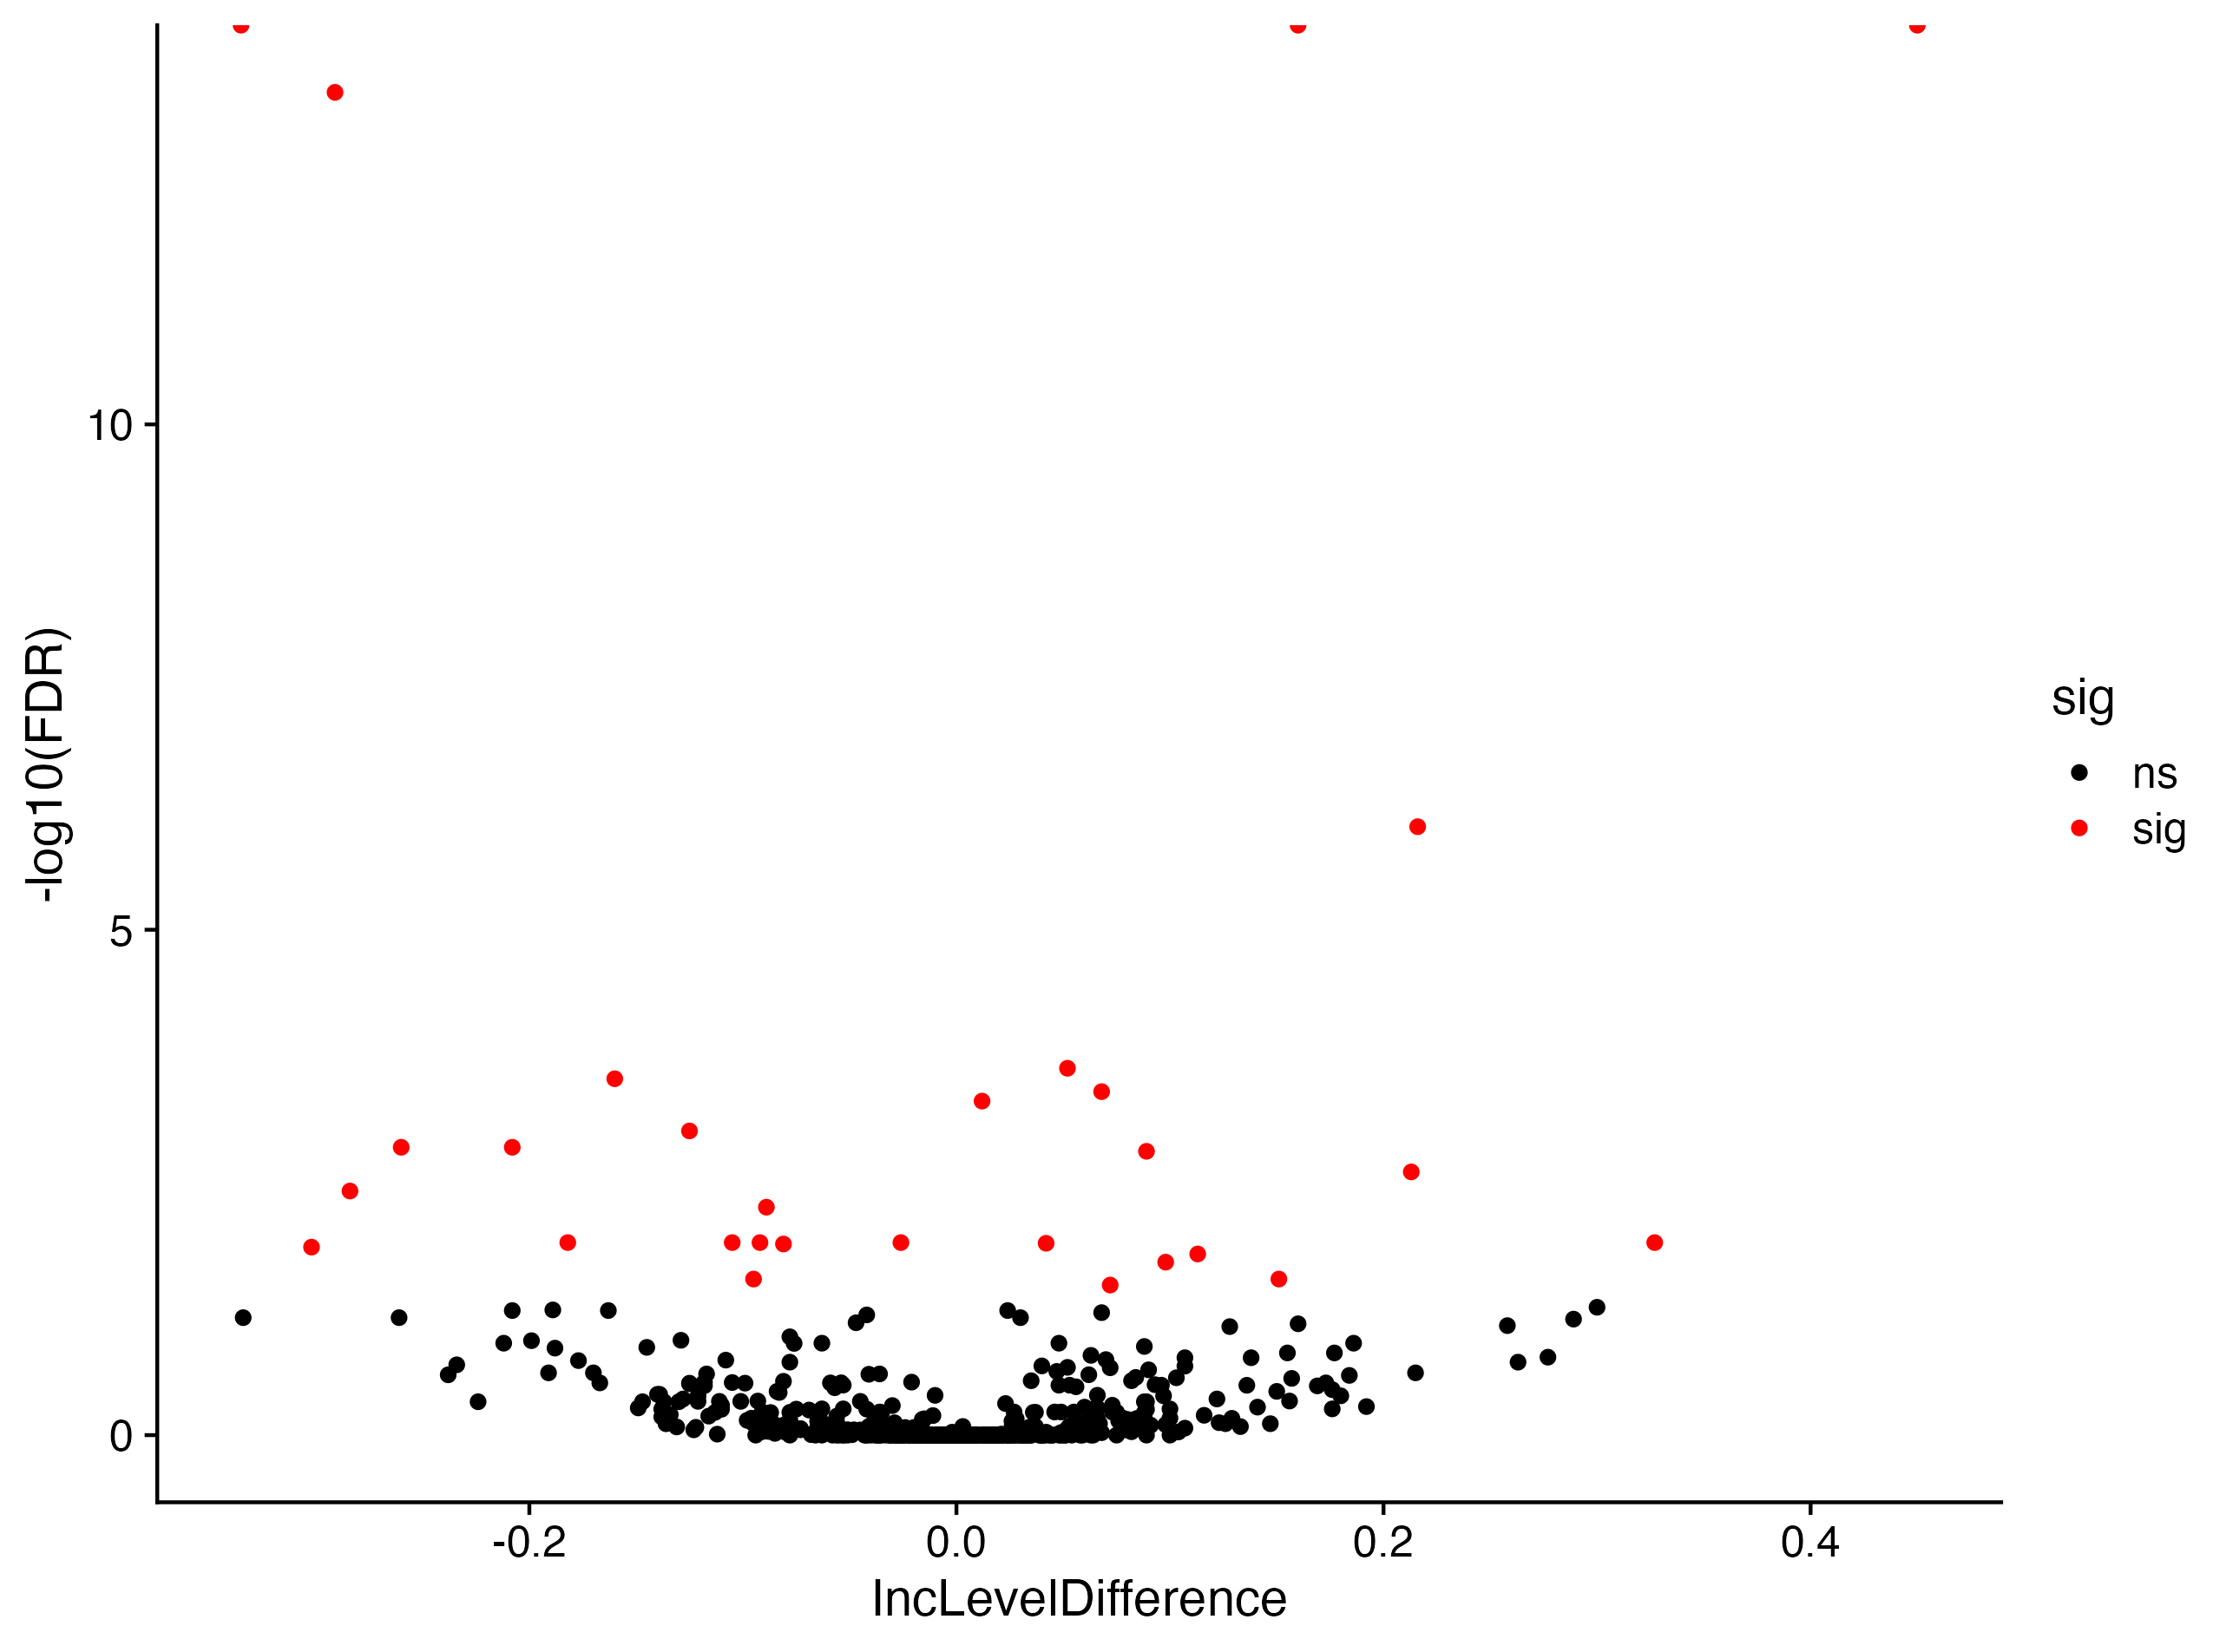
# Add another column to table that says whether or not this event is significant (FDR < 0.05)
psis_filt_psi <- psis_filt_psi %>%
mutate(., sig = ifelse(FDR <= 0.05, "sig", "ns"))
# Volcano Plot with sig events in red
ggplot(
data = psis_filt_psi,
aes(
x = IncLevelDifference,
y = -log10(FDR),
color = sig
)
) +
scale_color_manual(values = c("black", "red")) +
geom_point() +
theme_cowplot()