layerchart-upset
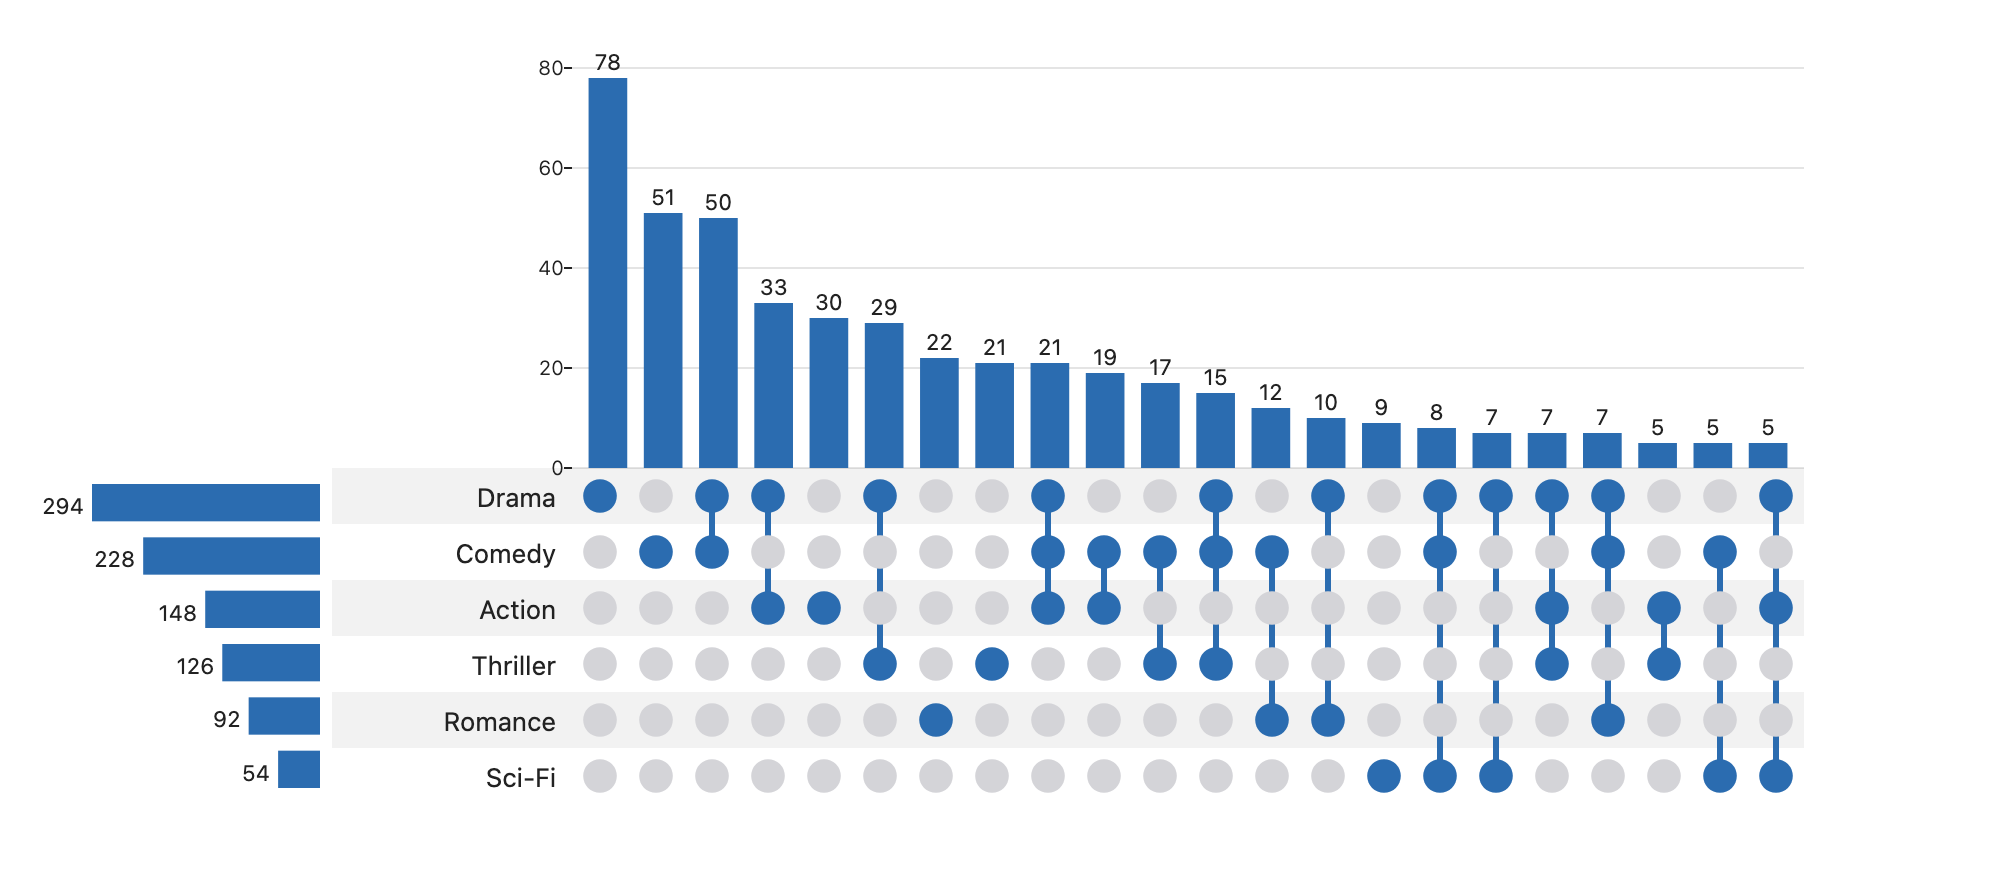
An UpSet plot Svelte 5 component built on LayerChart, with an API modelled on R's ComplexUpset.

Install
npm install layerchart-upsetRequires Svelte 5 (a peer dependency). layerchart and d3-scale come with the package. Then import UpSet, give it
data and sets, and size it with the props below.
Use
<script>
  import { UpSet } from 'layerchart-upset';
  // one row per item, one boolean column per set
  const data = [{ A: true, B: false, C: true }, /* ... */];
</script>

<UpSet {data} sets={['A', 'B', 'C']} minSize={2} bind:selected />
Precomputed counts
Already have the counts? Skip the per-item rows:
<UpSet
  sets={['treated vs control', 'KO vs WT']}
  intersections={[
    { id: 'a', sets: ['treated vs control'], size: 42 },
    { id: 'c', sets: ['treated vs control', 'KO vs WT'], size: 9 }
  ]}
  emphasizedSets={['KO vs WT']}
  minSlots={8}
  bind:selected
/>
Order is kept as given (sort with sortIntersectionsBy). Add setSizes to show the set-size panel.
Accessibility and test hooks
Each bar is a role="button" with aria-label, aria-pressed, and is a Tab stop. Enter/Space select,
←/→/Home/End move focus, Esc clears. Hooks: data-upset-bar (+ data-id, data-n, data-tip),
data-upset-count, data-upset-row, data-upset-set-bar. Extra attributes on <UpSet> go to the root.
Props
| prop | default | |
|---|---|---|
data, sets |
– | rows with boolean membership columns, and the column names |
mode |
'distinct' |
distinct (exclusive), intersect (inclusive), union |
sortIntersectionsBy / Order |
cardinality / descending |
or degree, sets (matrix row order), none |
sortSetsBy / Order |
cardinality / descending |
|
minSize maxSize minDegree maxDegree limit (bindable) |
– | filter intersections |
hiddenSets (bindable) |
[] |
sets removed from the plot; with data the intersections are recomputed without them |
filterControls onfilterchange(filters, previous) |
false |
a bar above the plot to change min size, degree, limit and which sets show |
cellSize barHeight setBarWidth labelWidth |
28 200 150 120 | layout, px |
color |
#2b6cb0 |
string, or (intersection) => string to color each column |
setColors, highlightColor |
– | per-set colors; color of the selected column |
inactiveColor dimOpacity |
inactive dots; opacity of non-focused columns (1 disables dimming) | |
dotRadius connectorWidth barPadding barRadius fontSize |
.3 3 .3 2 12 | geometry / typography |
intersectionLabel setLabel |
– | axis titles |
showLabels stripes |
true | toggles |
selected (bindable) |
id of the selected intersection (click / Enter / Space); Esc or the Clear button resets it | |
annotation (snippet) annotationHeight |
24 |
a row of HTML between the size bars and the matrix; the snippet renders once per column with { intersection, index, x, width, height } (x is relative to the matrix) and dims with the column. Not included in exportSVG; the layout is unchanged unless you pass it |
clearButton |
true |
show a "Clear selection" button while a column or set is selected |
selectedSet (bindable) |
name of the selected set (click a set bar or row label, Enter/Space, Esc clears); columns without it are dimmed | |
onsetselect(set, previous) |
called when a set is selected or cleared (null) |
|
scale (bindable) setScale |
linear |
size scale of the bars: linear, log or symlog (shows 0); setScale overrides the set-size panel |
scaleToggle onscalechange(next, previous) |
false |
a button that switches linear ↔ log (symlog when a size is 0) |
queries |
[{ id, color, filter(item) }]: draws an overlay bar per query in every column, as tall as the number of its rows passing filter (painted in order, largest first; not stacked). Needs data and keepItems; the default tooltip lists the counts. queryCounts(result, queries) gives the same numbers without the component |
|
stack |
{ by, colors?, order?, legend? }: split each size bar by a row attribute (by is a key or (item) => string; missing values are (none)). Segments replace the bar fill; order is bottom to top (default: by overall count); legend shows swatches. Linear scale and data only (otherwise ignored with a warning); wins over queries. stackSegments(result, by) gives the counts |
|
normalize |
none |
total labels the size axes and bar labels as a percentage of all items; bars are unchanged. Needs a known total (pass total with precomputed input), otherwise counts are shown |
showEmpty |
false |
also list combinations no item has, as size-0 columns (degree filters apply; minSize then defaults to 0; ignored above 20 sets). Under scale="log" zeros get no bar; use symlog to draw them |
keepItems |
true |
false leaves each intersection's items empty, for large inputs where only counts matter |
controlled |
false |
owner holds the interactive state: clicks, Enter/Space, Esc, set selection and the scale toggle only call their callbacks; selected, selectedSet and scale are never assigned internally |
onselect(selected, previous) |
called on every selection change; previous is the intersection that was selected before (or cleared), null if none |
|
onresult({ shown, total, hidden }) |
called when the result changes; total counts intersections before limit and the size/degree filters |
|
footer (snippet) |
rendered below the plot with { shown, total, hidden }, e.g. "the largest N of M combinations are drawn" |
|
intersectionsTotal |
precomputed input: how many intersections existed before you truncated the list (defaults to its length) | |
maxWidth |
– | number (px) or CSS length; wide plots scroll inside their own wrapper instead of overflowing the page |
fit minCellSize |
false 12 |
shrink cellSize toward minCellSize so the matrix fits its container; scrolls below the minimum |
intersections setSizes total |
– | precomputed input (see above) |
tooltip |
true | false disables tooltips, true is the built-in one, a snippet replaces its content |
describe, onhover |
tooltip / aria-label text, hover event |
|
setLabels emphasizedSets emphasisMarker maxLabelLength |
row labels | |
showSetSizes minSlots yTicks setTicks formatSize |
layout / axis |
computeUpset(data, sets, options) is exported for use without the component. See the Gallery for every option in action.
Run npm run dev for the demo page.
Controlled selection
If something else owns the selection (a URL hash, a store), pass selected one-way with controlled:
<UpSet {data} {sets} controlled selected={pick} onselect={(i, prev) => requestChange(i?.id ?? null)} />The component never changes selected itself. It calls onselect(i, previous) (or onselect(null, previous) for a
deselect or Esc) and waits for you to update the prop, so the owner can reject or defer the change.
Without controlled, bind:selected works as before.
Hidden intersections
limit, minSize, maxSize, minDegree and maxDegree drop intersections silently. Say so with onresult or the
footer snippet. total counts intersections before those options apply, so 50 intersections with limit={30}
reports { shown: 30, total: 50, hidden: 20 }.
<UpSet {data} {sets} limit={30}>
  {#snippet footer({ shown, total })}the largest {shown} of {total} combinations are drawn{/snippet}
</UpSet>
Wide plots
Set maxWidth to keep 30+ columns from running off the page; the plot scrolls inside its own wrapper and the tooltip
still follows the bars. Use fit to shrink the cells to the width of the container instead (never below minCellSize);
if it still doesn't fit, it scrolls. Keyboard focus scrolls an off-screen bar into view.
Theming
Colours resolve in this order: the prop (color, inactiveColor, highlightColor, setColors), then a CSS custom
property, then the built-in default. Set the properties on any ancestor of the chart. Because they are plain CSS they
follow data-theme / prefers-color-scheme changes at runtime without re-rendering. A per-intersection color
function, setColors and highlightColor still win for the marks they colour.
| Property | Colours | Default |
|---|---|---|
--upset-bar |
intersection bars and set-size bars | #2b6cb0 |
--upset-bar-selected |
the selected bar, its dots and connector | --upset-bar |
--upset-dot-on |
active matrix dots and connector lines | --upset-bar |
--upset-dot-off |
inactive matrix dots | #d4d4d8 |
--upset-text |
set names and count labels | currentColor |
--upset-grid |
y-axis grid lines | currentColor at 12% |
--upset-expected |
showExpected dashes |
#f59e0b |
--upset-label-halo |
outline behind count labels when showExpected is on |
Canvas |
--upset-stripe |
alternate row shading | currentColor at 6% |
--upset-grid and --upset-stripe are the final colour, so include any transparency in the value. The tooltip keeps
its own --upset-tooltip-fg / --upset-tooltip-bg.
:root[data-theme='dark'] {
  --upset-bar: #63b3ed;
  --upset-bar-selected: #f6ad55;
  --upset-dot-off: #3b4252;
  --upset-text: #e2e8f0;
  --upset-grid: rgb(226 232 240 / 0.15);
  --upset-stripe: rgb(226 232 240 / 0.06);
}
Development
npm run check, npm test and npm run build run in CI on every push and PR.