Plot continuous V(D)J data
Usage
plot_vdj(
  input,
  data_col,
  per_cell = FALSE,
  summary_fn = mean,
  cluster_col = NULL,
  group_col = NULL,
  chain = NULL,
  method = "histogram",
  units = "frequency",
  plot_colors = NULL,
  plot_lvls = names(plot_colors),
  trans = "identity",
  panel_nrow = NULL,
  panel_scales = "free_x",
  chain_col = "chains",
  sep = ";",
  ...
)
Arguments
- input
Single cell object or data.frame containing V(D)J data. If a data.frame is provided, cell barcodes should be stored as row names.
- data_col
meta.data column(s) containing continuous V(D)J data to plot
- per_cell
Should values be plotted per cell, i.e. each data point would represent one cell. If TRUE, values will be summarized for each cell using summary_fn. If FALSE, values will be plotted for each chain.
- summary_fn
Function to use for summarizing values when per_cell is TRUE, possible values can be either a function, e.g. mean, or a purrr-style lambda, e.g. ~ mean(.x, na.rm = TRUE) where '.x' refers to the column. If NULL, the mean will be calculated.
- cluster_col
meta.data column containing cluster IDs to use for grouping cells for plotting
- group_col
meta.dats column to use for grouping clusters present in cluster_col
- chain
Chain(s) to use for filtering data before plotting. If NULL data will not be filtered based on chain.
- method
Method to use for plotting, possible values are:
'histogram'
'density'
'boxplot'
'violin'
- units
Units to use for y-axis when method is set to 'histogram'. Use 'frequency' to show number of values or 'percent' to show the percentage of total values.
- plot_colors
Character vector specifying colors to use for cell clusters specified by cluster_col. When cluster_col is NULL, plot colors can be directly modified with the ggplot2 parameters color and fill, e.g. fill = "red", color = "black"
- plot_lvls
Character vector containing order to use for plotting cell clusters specified by cluster_col
- trans
Transformation to use for plotting data, e.g. 'log10'. By default values are not transformed, refer to
ggplot2::continuous_scale()for more options.- panel_nrow
The number of rows to use for arranging plot panels
- panel_scales
Should scales for plot panels be fixed or free. This passes a scales specification to ggplot2::facet_wrap, can be 'fixed', 'free', 'free_x', or 'free_y'. 'fixed' will cause panels to share the same scales.
- chain_col
meta.data column containing chains for each cell
- sep
Separator used for storing per-chain V(D)J data for each cell
- ...
Additional arguments to pass to ggplot2, e.g. color, fill, size, linetype, etc.
See also
summarize_vdj() for more examples on how per-chain data can be
summarized for each cell
Examples
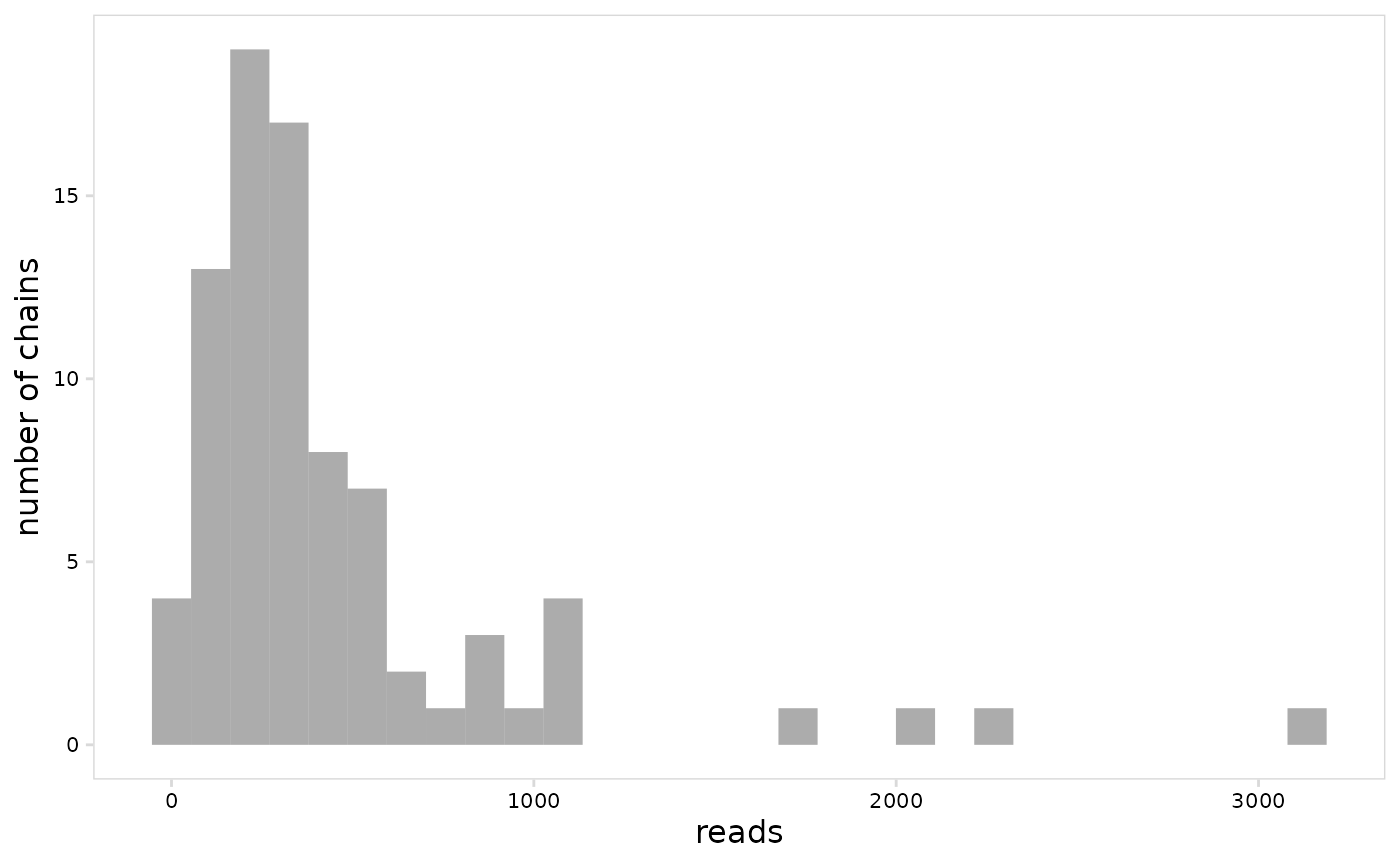
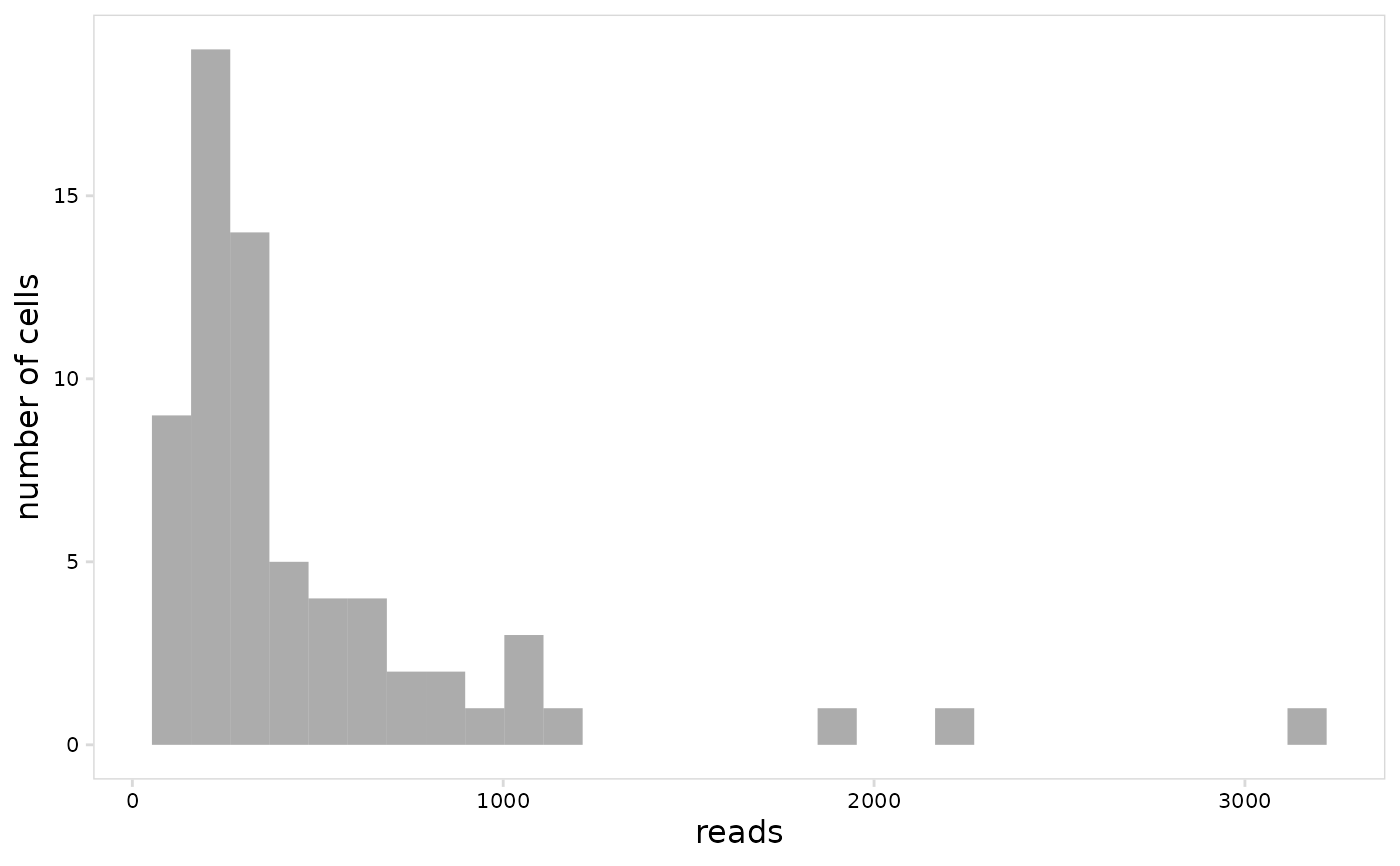
# Create histogram
plot_vdj(
vdj_sce,
data_col = "reads"
)
#> `stat_bin()` using `bins = 30`. Pick better value with `binwidth`.
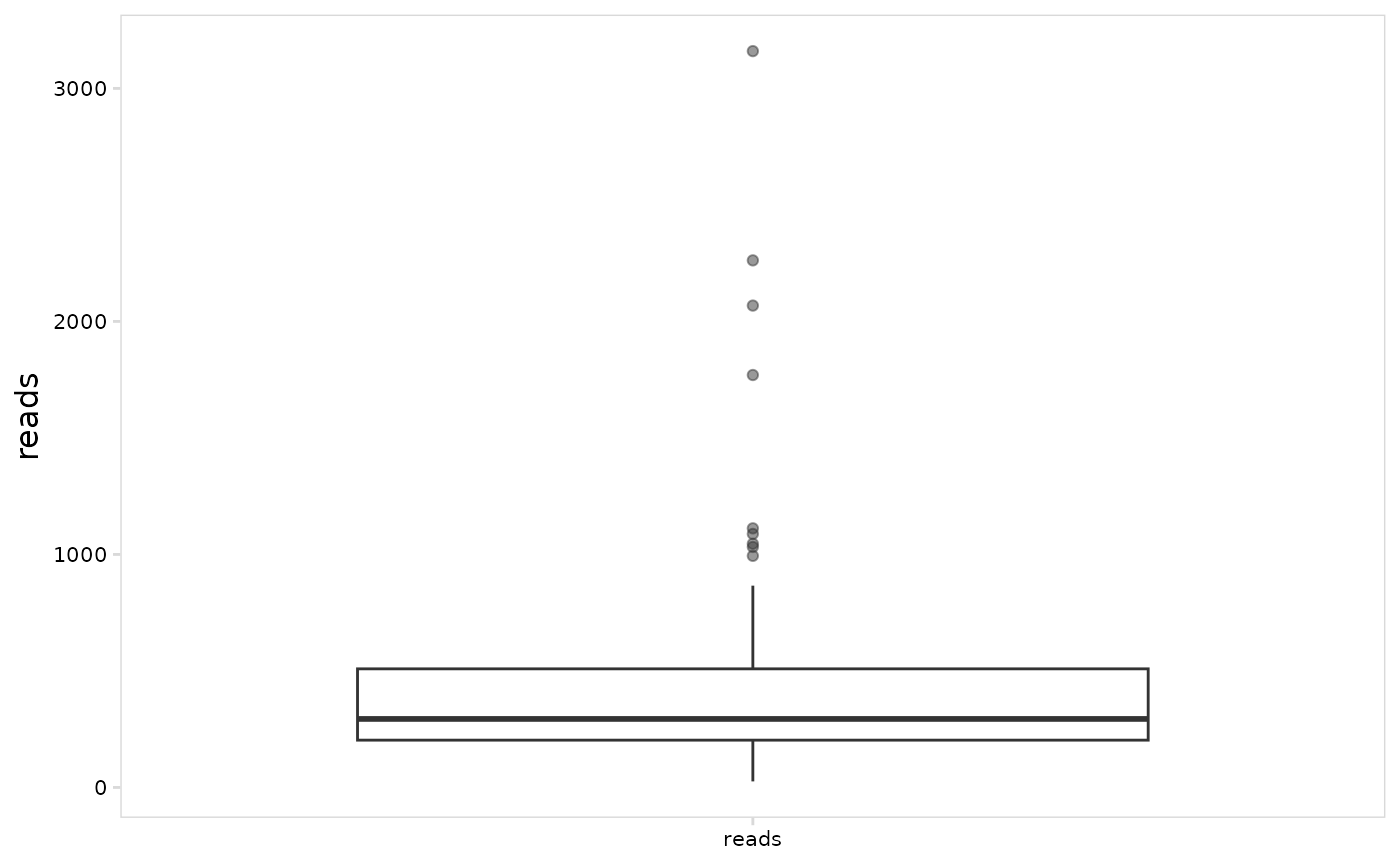
 # Create boxplots
plot_vdj(
vdj_sce,
data_col = "reads",
method = "boxplot"
)
# Create boxplots
plot_vdj(
vdj_sce,
data_col = "reads",
method = "boxplot"
)
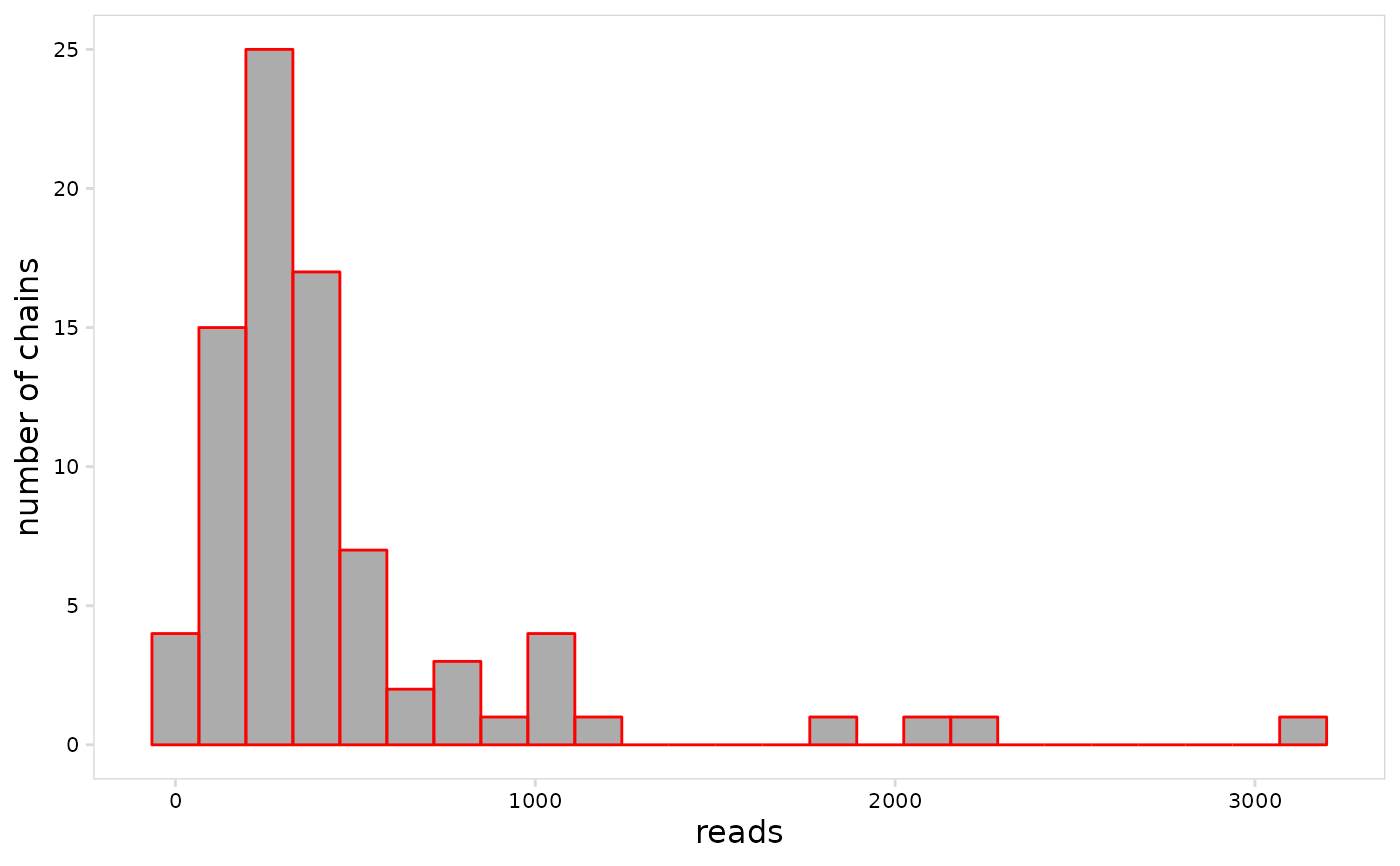
 # Pass additional arguments to ggplot2
plot_vdj(
vdj_so,
data_col = "reads",
color = "red",
bins = 25
)
# Pass additional arguments to ggplot2
plot_vdj(
vdj_so,
data_col = "reads",
color = "red",
bins = 25
)
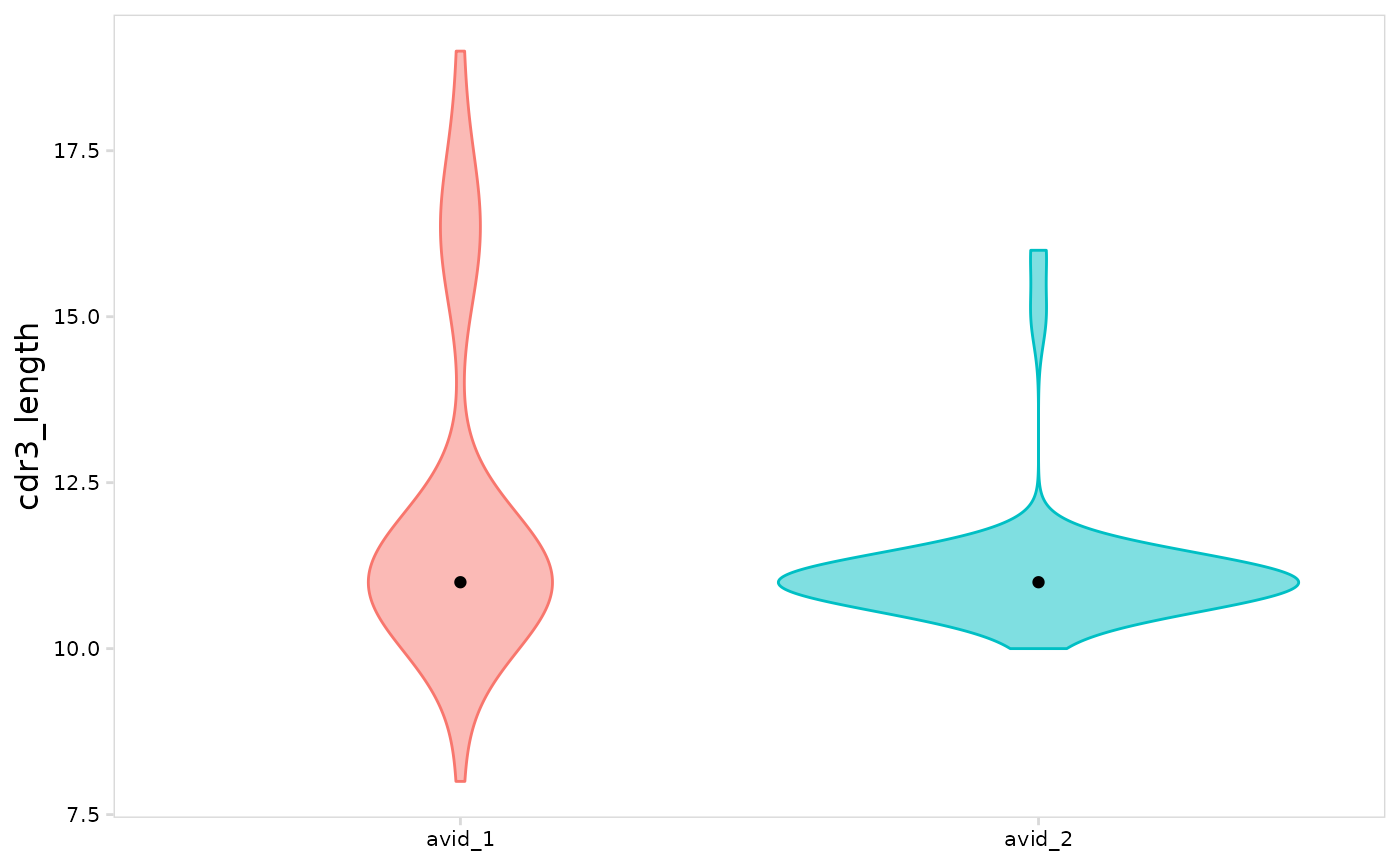
 # Compare cell clusters
plot_vdj(
vdj_sce,
data_col = "cdr3_length",
cluster_col = "orig.ident",
method = "violin"
)
# Compare cell clusters
plot_vdj(
vdj_sce,
data_col = "cdr3_length",
cluster_col = "orig.ident",
method = "violin"
)
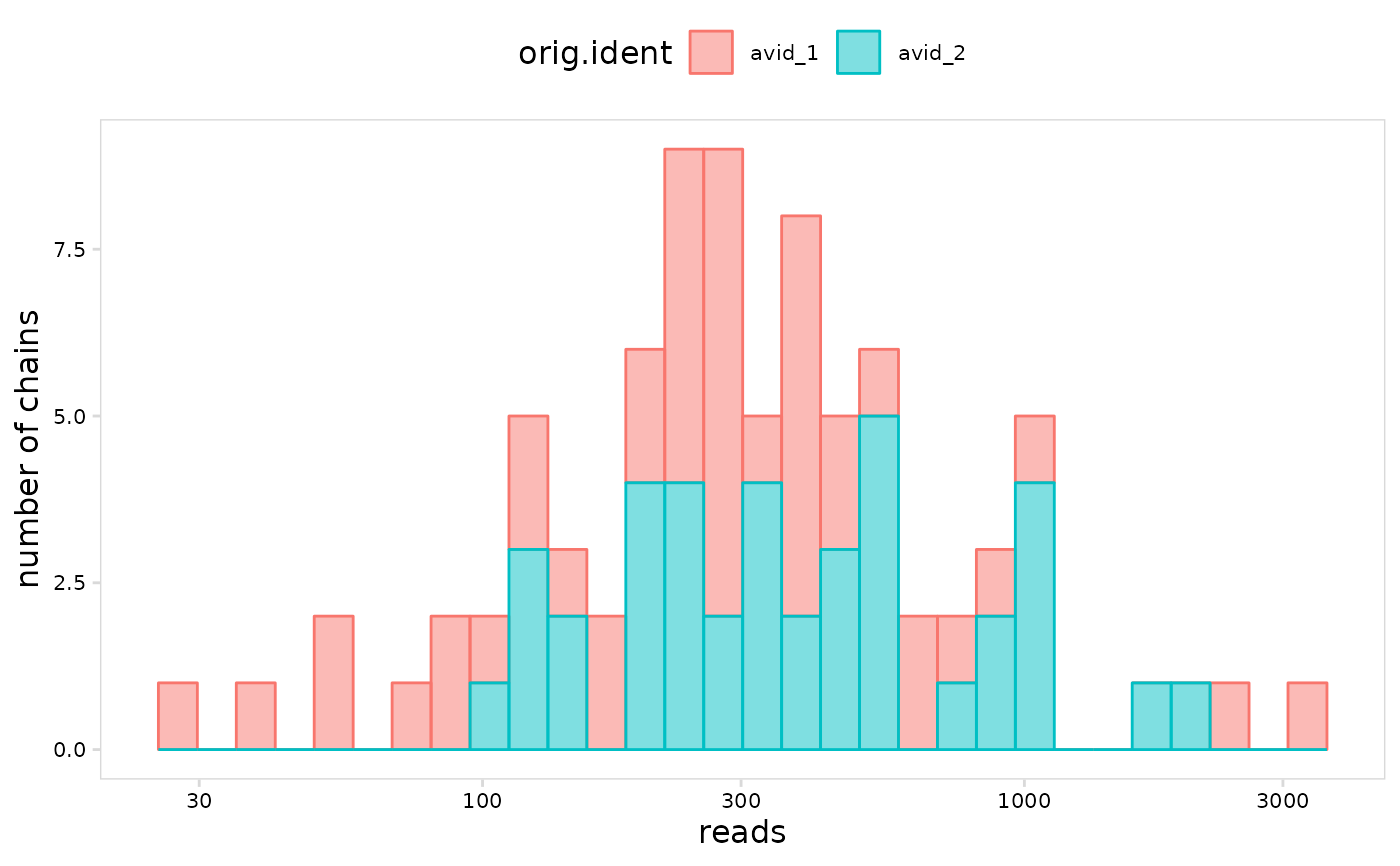
 # log10 transform the axis
plot_vdj(
vdj_so,
data_col = "reads",
cluster_col = "orig.ident",
trans = "log10"
)
#> `stat_bin()` using `bins = 30`. Pick better value with `binwidth`.
# log10 transform the axis
plot_vdj(
vdj_so,
data_col = "reads",
cluster_col = "orig.ident",
trans = "log10"
)
#> `stat_bin()` using `bins = 30`. Pick better value with `binwidth`.
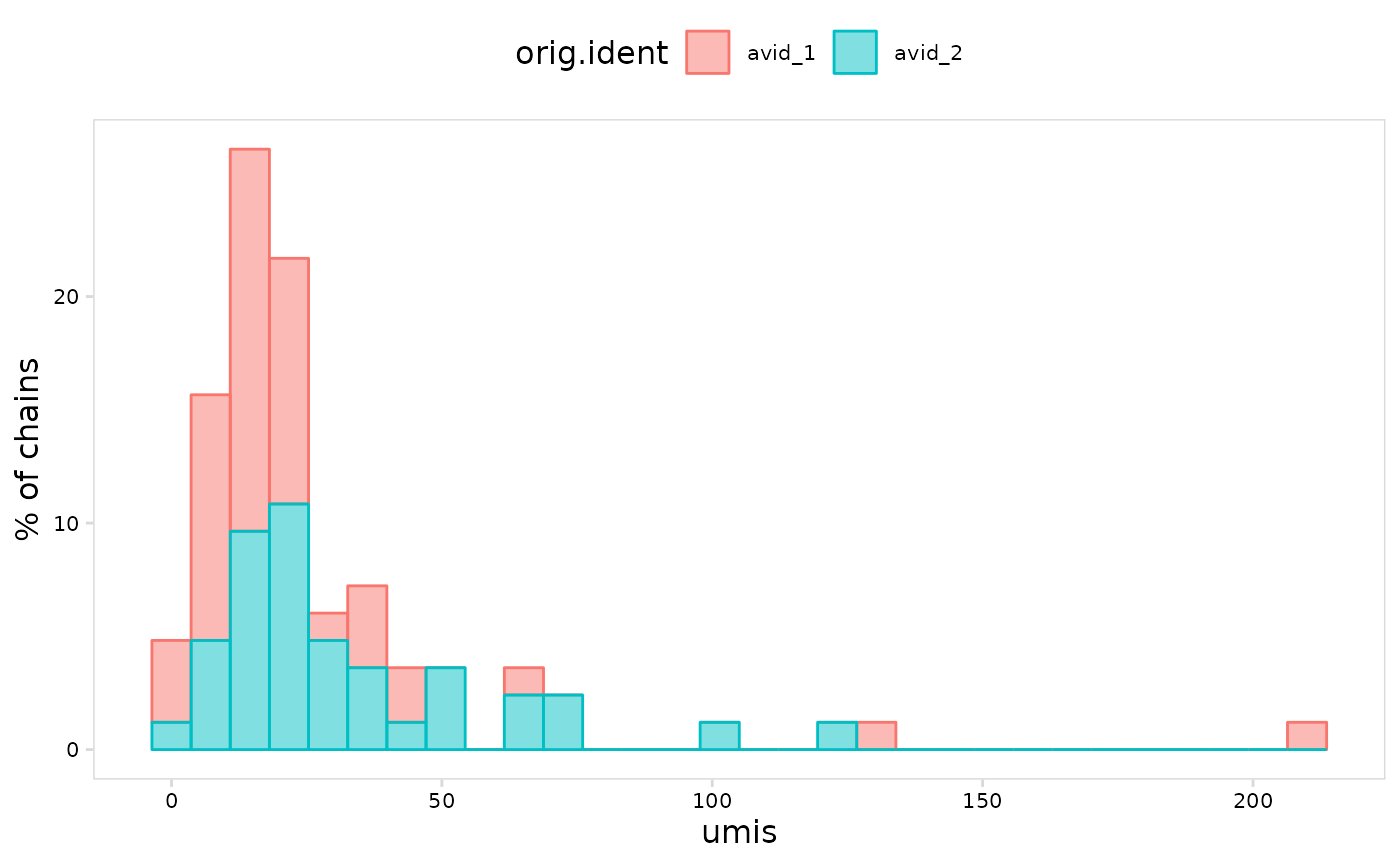
 # Express y-axis units as percent of total values
plot_vdj(
vdj_sce,
data_col = "umis",
cluster_col = "orig.ident",
units = "percent"
)
#> Warning: The dot-dot notation (`..count..`) was deprecated in ggplot2 3.4.0.
#> ℹ Please use `after_stat(count)` instead.
#> ℹ The deprecated feature was likely used in the djvdj package.
#> Please report the issue at <https://github.com/rnabioco/djvdj/issues>.
#> `stat_bin()` using `bins = 30`. Pick better value with `binwidth`.
# Express y-axis units as percent of total values
plot_vdj(
vdj_sce,
data_col = "umis",
cluster_col = "orig.ident",
units = "percent"
)
#> Warning: The dot-dot notation (`..count..`) was deprecated in ggplot2 3.4.0.
#> ℹ Please use `after_stat(count)` instead.
#> ℹ The deprecated feature was likely used in the djvdj package.
#> Please report the issue at <https://github.com/rnabioco/djvdj/issues>.
#> `stat_bin()` using `bins = 30`. Pick better value with `binwidth`.
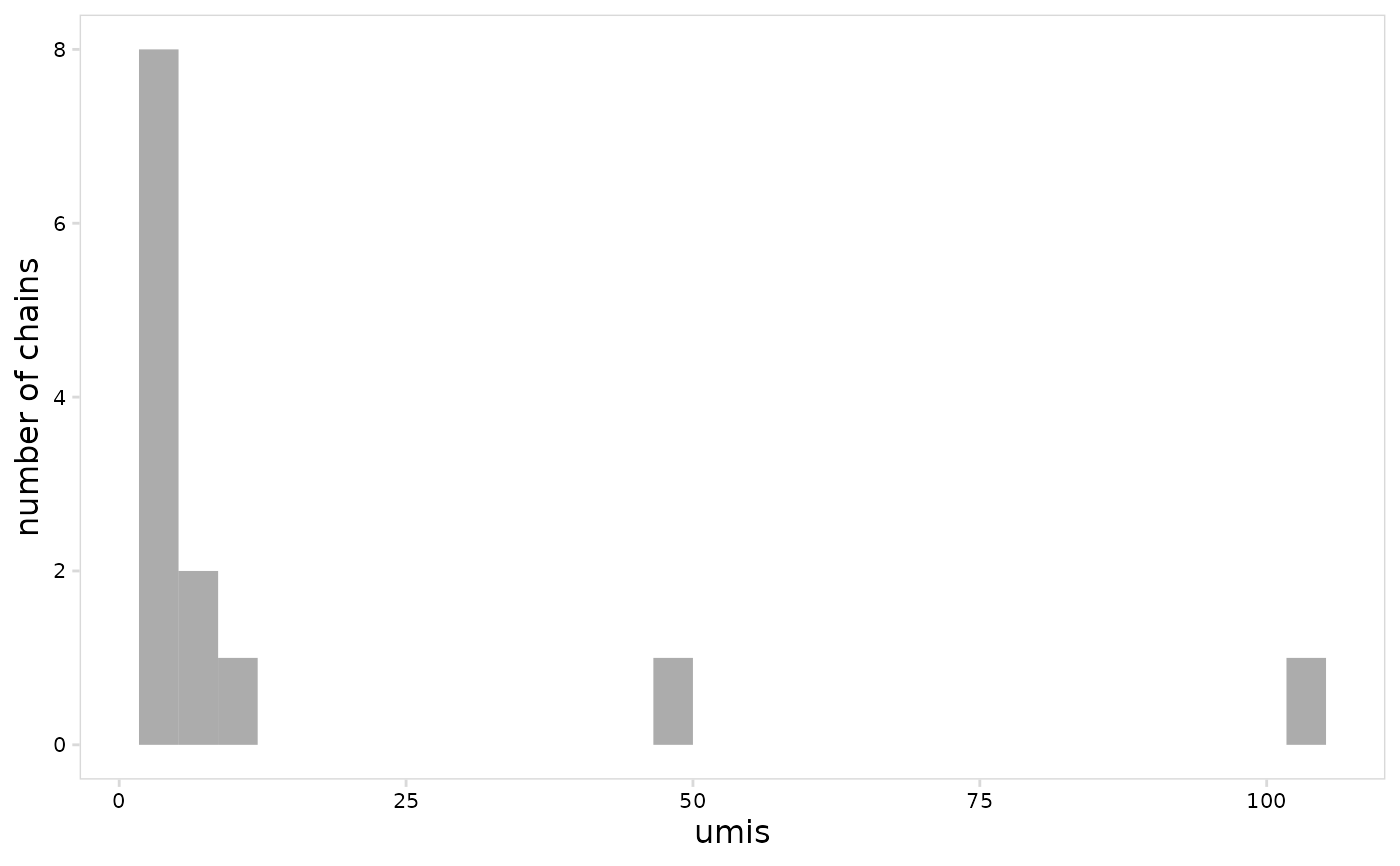
 # Only plot values for heavy chains
plot_vdj(
vdj_so,
data_col = "umis",
chain = "IGH"
)
#> `stat_bin()` using `bins = 30`. Pick better value with `binwidth`.
# Only plot values for heavy chains
plot_vdj(
vdj_so,
data_col = "umis",
chain = "IGH"
)
#> `stat_bin()` using `bins = 30`. Pick better value with `binwidth`.
 # Plot the median number of reads for each cell
plot_vdj(
vdj_sce,
data_col = "reads",
per_cell = TRUE,
summary_fn = stats::median
)
#> `stat_bin()` using `bins = 30`. Pick better value with `binwidth`.
# Plot the median number of reads for each cell
plot_vdj(
vdj_sce,
data_col = "reads",
per_cell = TRUE,
summary_fn = stats::median
)
#> `stat_bin()` using `bins = 30`. Pick better value with `binwidth`.
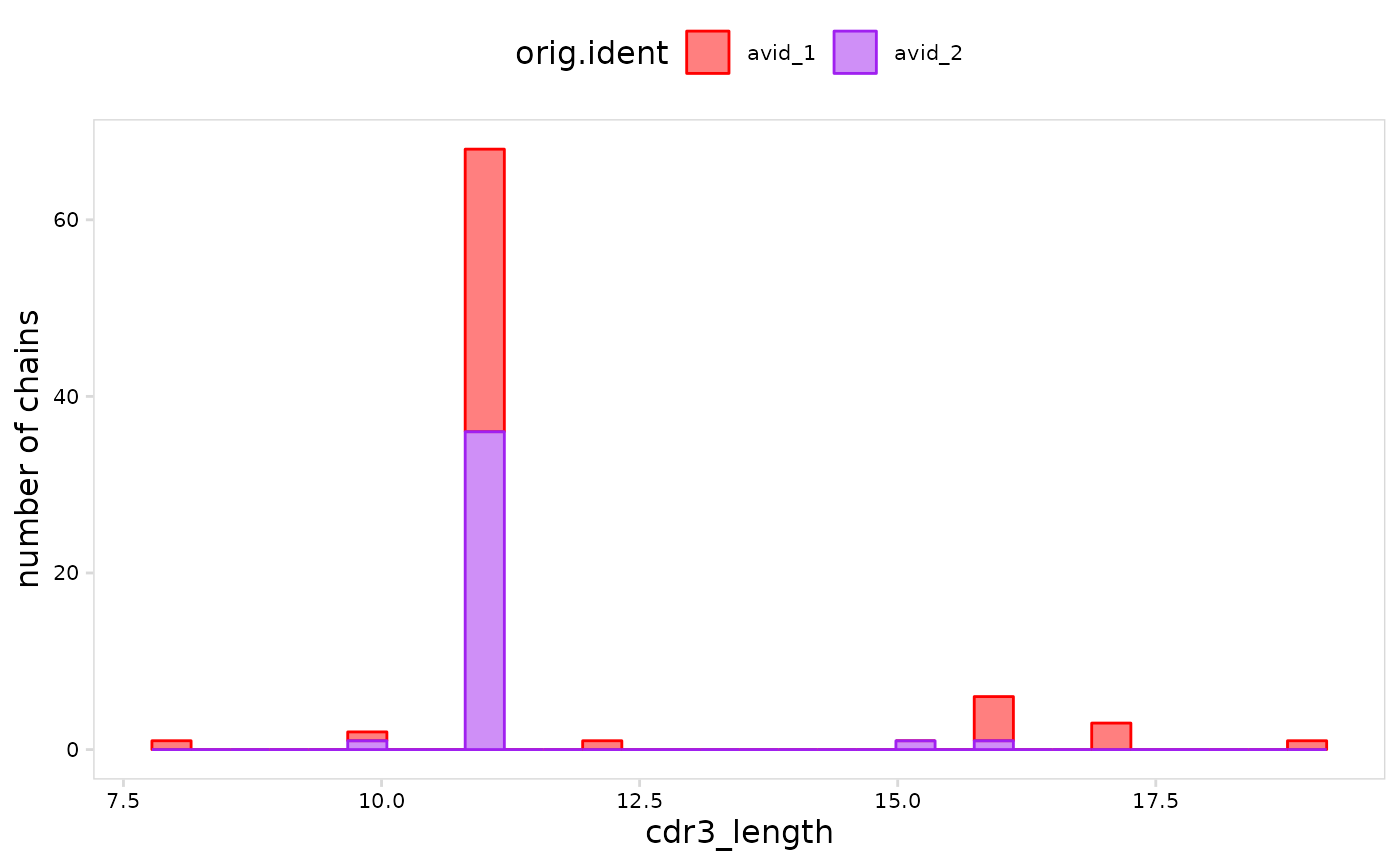
 # Set colors for cell clusters
plot_vdj(
vdj_so,
data_col = "cdr3_length",
cluster_col = "orig.ident",
plot_colors = c(avid_1 = "red", avid_2 = "purple")
)
#> `stat_bin()` using `bins = 30`. Pick better value with `binwidth`.
# Set colors for cell clusters
plot_vdj(
vdj_so,
data_col = "cdr3_length",
cluster_col = "orig.ident",
plot_colors = c(avid_1 = "red", avid_2 = "purple")
)
#> `stat_bin()` using `bins = 30`. Pick better value with `binwidth`.
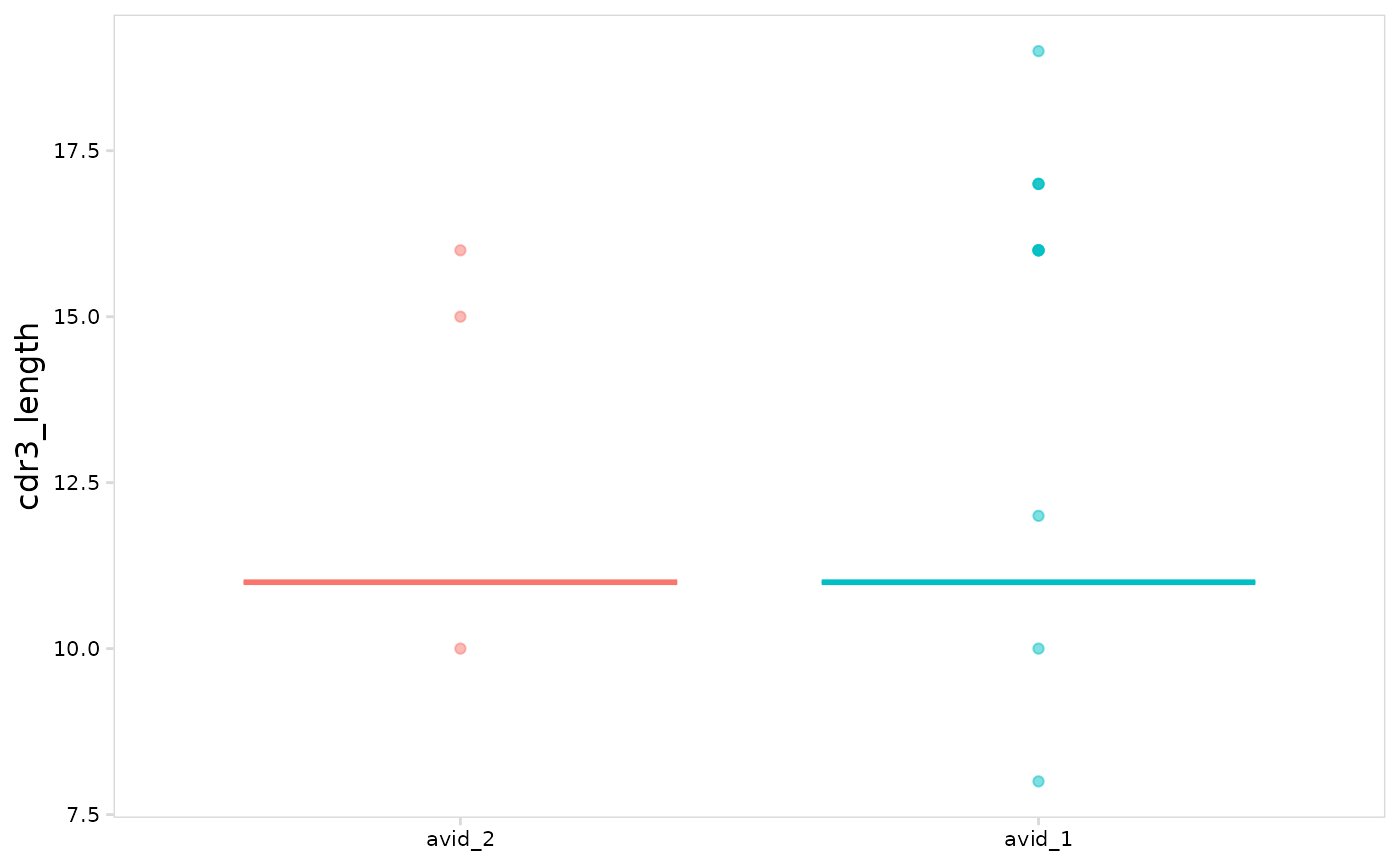
 # Set order to use for plotting cell clusters
plot_vdj(
vdj_sce,
data_col = "cdr3_length",
cluster_col = "orig.ident",
plot_lvls = c("avid_2", "avid_1"),
method = "boxplot"
)
# Set order to use for plotting cell clusters
plot_vdj(
vdj_sce,
data_col = "cdr3_length",
cluster_col = "orig.ident",
plot_lvls = c("avid_2", "avid_1"),
method = "boxplot"
)