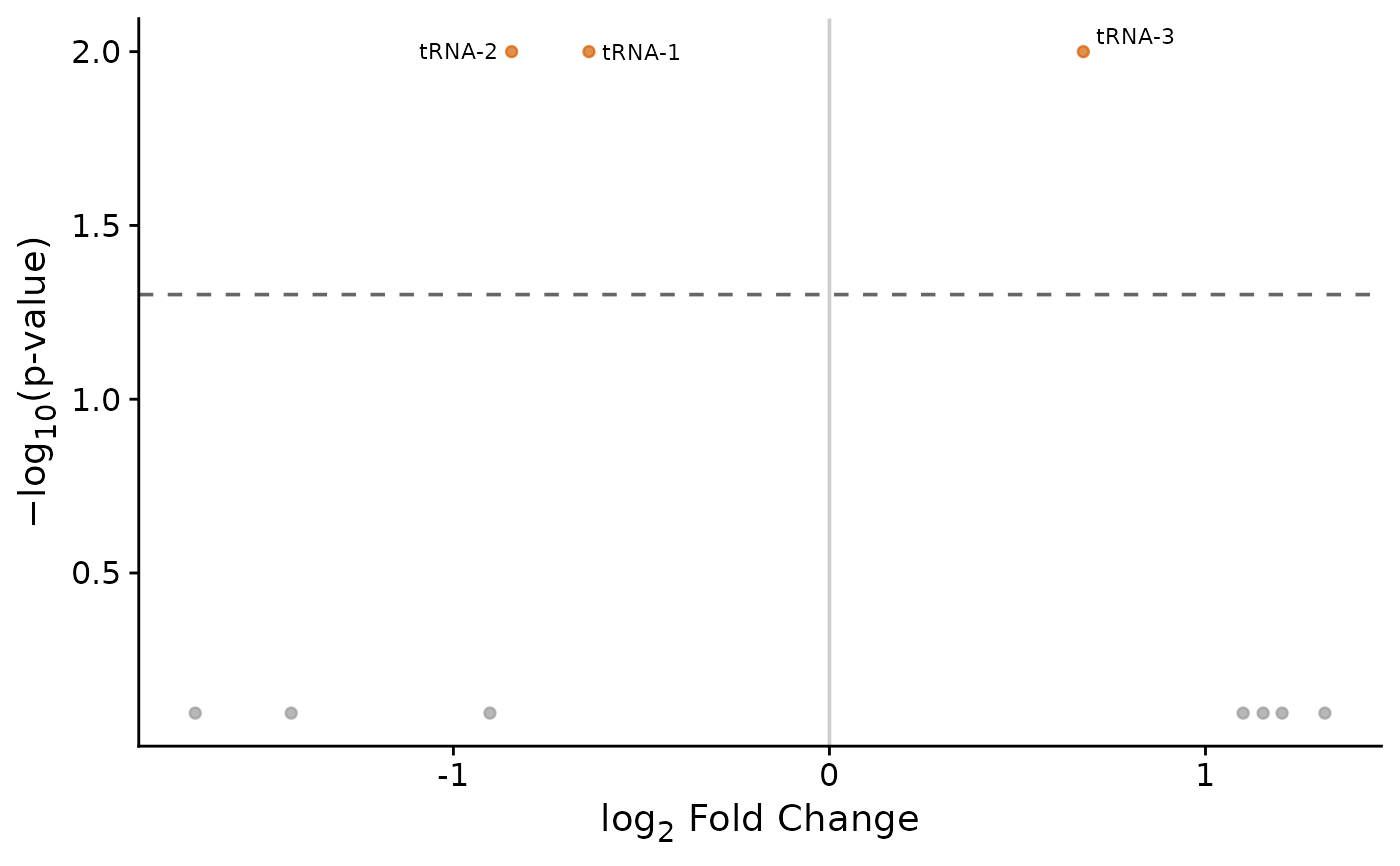
Creates a volcano plot from the tibble returned by
tidy_deseq_results(). Significant points are labeled with
ggrepel::geom_text_repel().
Usage
plot_volcano(
  data,
  lab_col = "ref",
  padj_cutoff = 0.05,
  max_overlaps = 20,
  point_size = 1.5,
  label_size = 3,
  sig_color = "#D55E00",
  nonsig_color = "grey60"
)
Arguments
- data
A tibble from
tidy_deseq_results()with at leastlog2FoldChange,padj, andsignificantcolumns.- lab_col
Column name (string) used for point labels. Default
"ref".- padj_cutoff
Numeric; draws a dashed horizontal line at
-log10(padj_cutoff). Default0.05.- max_overlaps
Maximum number of overlapping labels passed to
ggrepel::geom_text_repel(). Default20.- point_size
Numeric size for
ggplot2::geom_point(). Default1.5.- label_size
Numeric size for
ggrepel::geom_text_repel(). Default3.- sig_color
Color for significant points. Default
"#D55E00".- nonsig_color
Color for non-significant points. Default
"grey60".