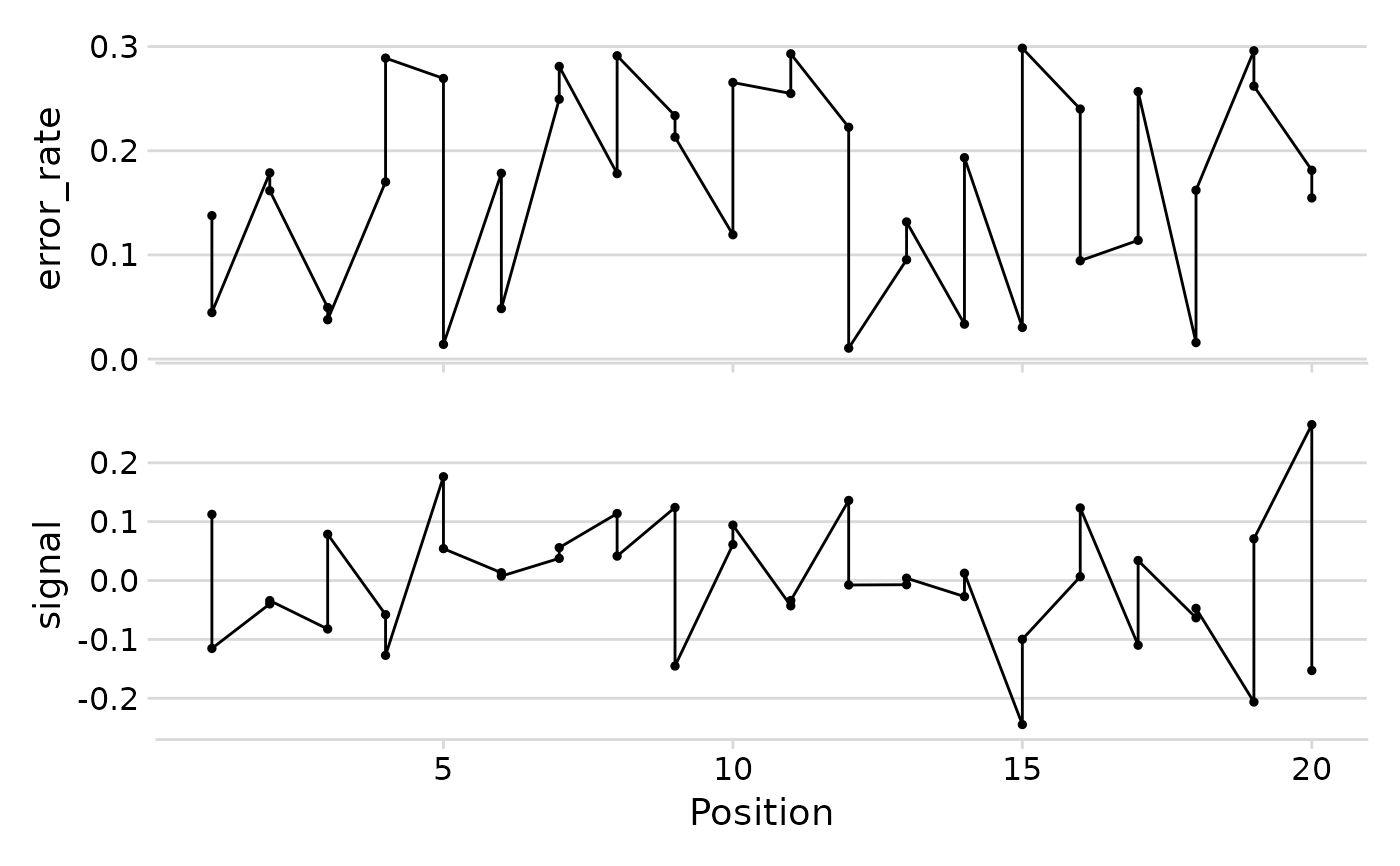
Create a stacked panel plot showing multiple metrics along the tRNA sequence. Each metric gets its own panel sharing a common x-axis. Optionally adds structural region background shading and a secondary x-axis with Sprinzl position labels.
Usage
plot_mod_landscape(
  data,
  metrics,
  pos_col = "pos",
  region_col = NULL,
  sprinzl_col = NULL,
  mod_col = NULL,
  title = NULL,
  heights = NULL
)
Arguments
- data
A data frame with a position column and one or more metric columns to plot.
- metrics
Character vector of column names to plot as stacked panels (one panel per metric).
- pos_col
Column name (string) for x-axis positions. Default
"pos".- region_col
Optional column name (string) for structural region labels, used for background shading. Default
NULL.- sprinzl_col
Optional column name (string) for Sprinzl position labels shown on a secondary x-axis. Default
NULL.- mod_col
Optional column name (string) of a logical column;
TRUEpositions are highlighted on the Sprinzl axis (requires ggtext). DefaultNULL.- title
Plot title. Default
NULL.- heights
Numeric vector of relative panel heights. Default
NULL(equal heights).