Plot a chord diagram of modification rewiring between conditions.
Source:R/plot-chord.R
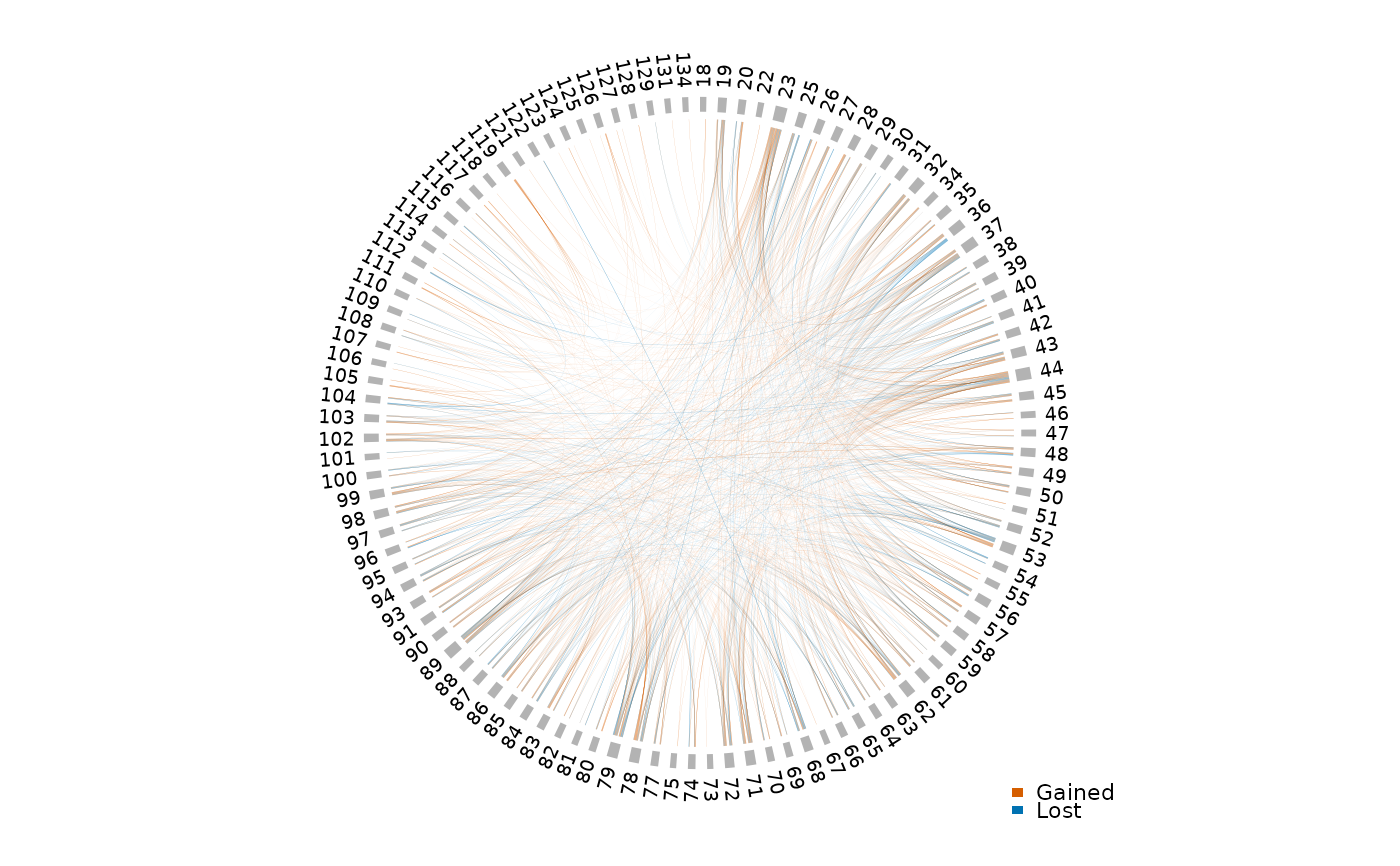
plot_chord_ror.RdDisplay a circlize chord diagram showing position pairs where modification co-occurrence has changed between two conditions, based on the ratio of odds ratios (ROR). Chords are colored by direction: gained dependencies (positive log ROR) vs. lost dependencies (negative log ROR).
Usage
plot_chord_ror(
  ror_data,
  ror_cutoff = 0.5,
  gained_color = "#D55E00",
  lost_color = "#0072B2",
  sprinzl_coords = NULL,
  mods = NULL,
  title = NULL,
  transparency = 0.4
)
Arguments
- ror_data
A tibble from
compute_ror()with columnspos1,pos2, andlog_ror.- ror_cutoff
Minimum absolute value of
log_rorfor a chord to be drawn. Default0.5.- gained_color
Color for gained dependencies (positive log ROR). Default
"#D55E00"(vermillion).- lost_color
Color for lost dependencies (negative log ROR). Default
"#0072B2"(blue).- sprinzl_coords
An optional tibble from
read_sprinzl_coords()used to order sectors and color by structural region.- mods
An optional tibble of modification annotations (e.g., from
fetch_modomics_mods()) with columnsposandmod1. When provided along withsprinzl_coords, modification positions are highlighted as an annotation ring.- title
Optional plot title.
- transparency
Transparency for chord colors. Default
0.4.
Examples
# \donttest{
results <- read_pipeline_results(
  clover_example("ecoli/config.yaml"),
  types = "odds_ratios"
)
or_data <- results$odds_ratios
or_data$condition <- ifelse(
  grepl("ctl", or_data$sample_id), "ctl", "inf"
)
ror <- compute_ror(or_data, numerator = "inf", denominator = "ctl")
plot_chord_ror(ror)

# }
# }