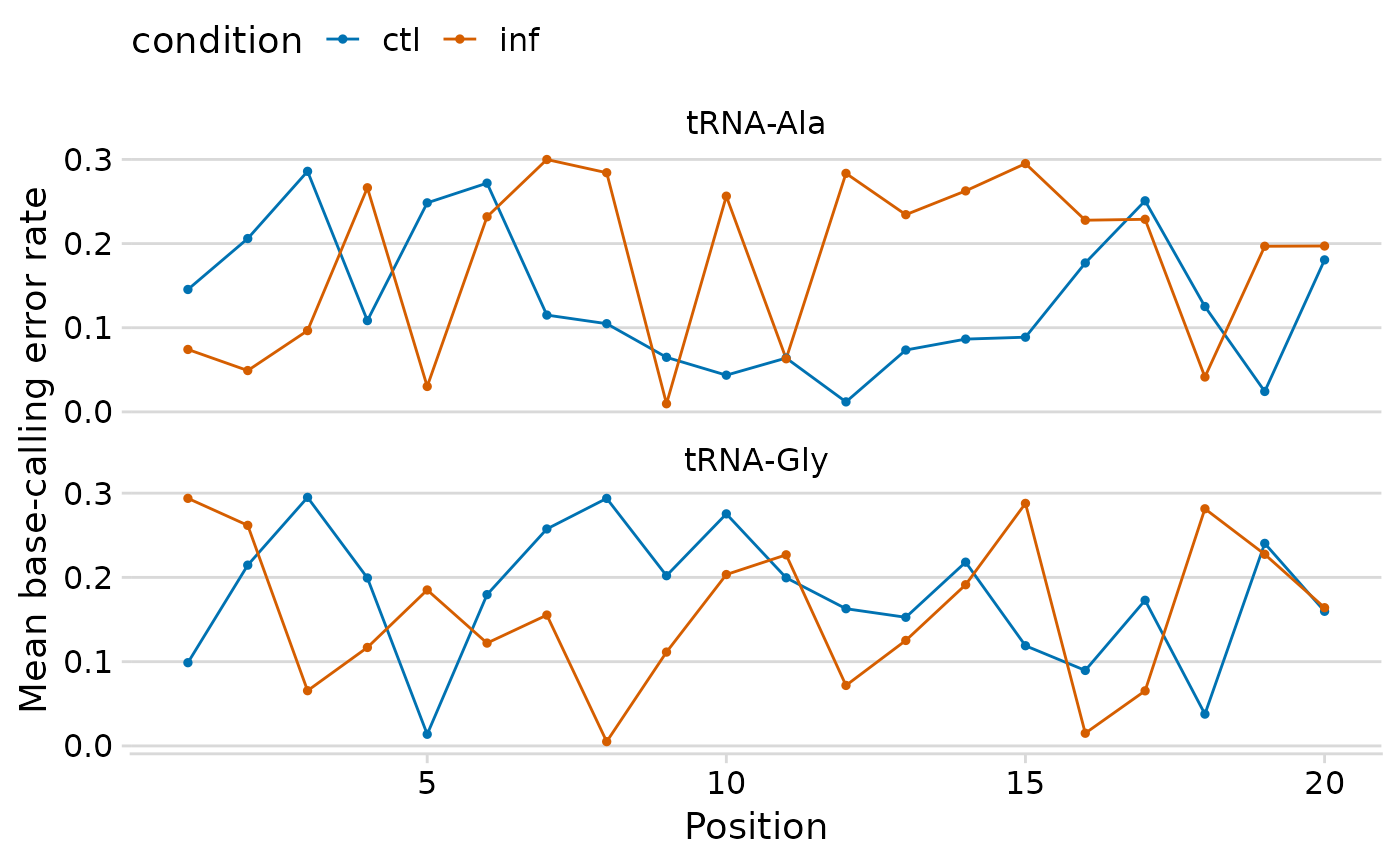
Create a line plot of per-position base-calling error rates, faceted by tRNA and colored by condition. Optionally overlay vertical dashed lines at known modification positions.
Usage
plot_bcerror_profile(
  data,
  refs = NULL,
  mods = NULL,
  colors = c(ctl = "#0072B2", inf = "#D55E00"),
  ncol = 1
)
Arguments
- data
A summarized bcerror tibble with columns
ref,pos,condition, andmean_error.- refs
Character vector of tRNA names to plot (filters
data$ref). IfNULL(default), all tRNAs are plotted.- mods
Optional tibble with
refandposcolumns marking modification positions (e.g., fromfetch_modomics_mods()).- colors
Named character vector of colors for conditions. Default
c(ctl = "#0072B2", inf = "#D55E00").- ncol
Number of columns for
ggplot2::facet_wrap(). Default1.
Examples
df <- tidyr::expand_grid(
  ref = c("tRNA-Ala", "tRNA-Gly"),
  pos = 1:20,
  condition = c("ctl", "inf")
)
df$mean_error <- runif(nrow(df), 0, 0.3)
plot_bcerror_profile(df)