Create a circular arc diagram from a tidygraph network built by
build_or_network(). Requires the ggraph package.
Usage
plot_arc_diagram(
graph,
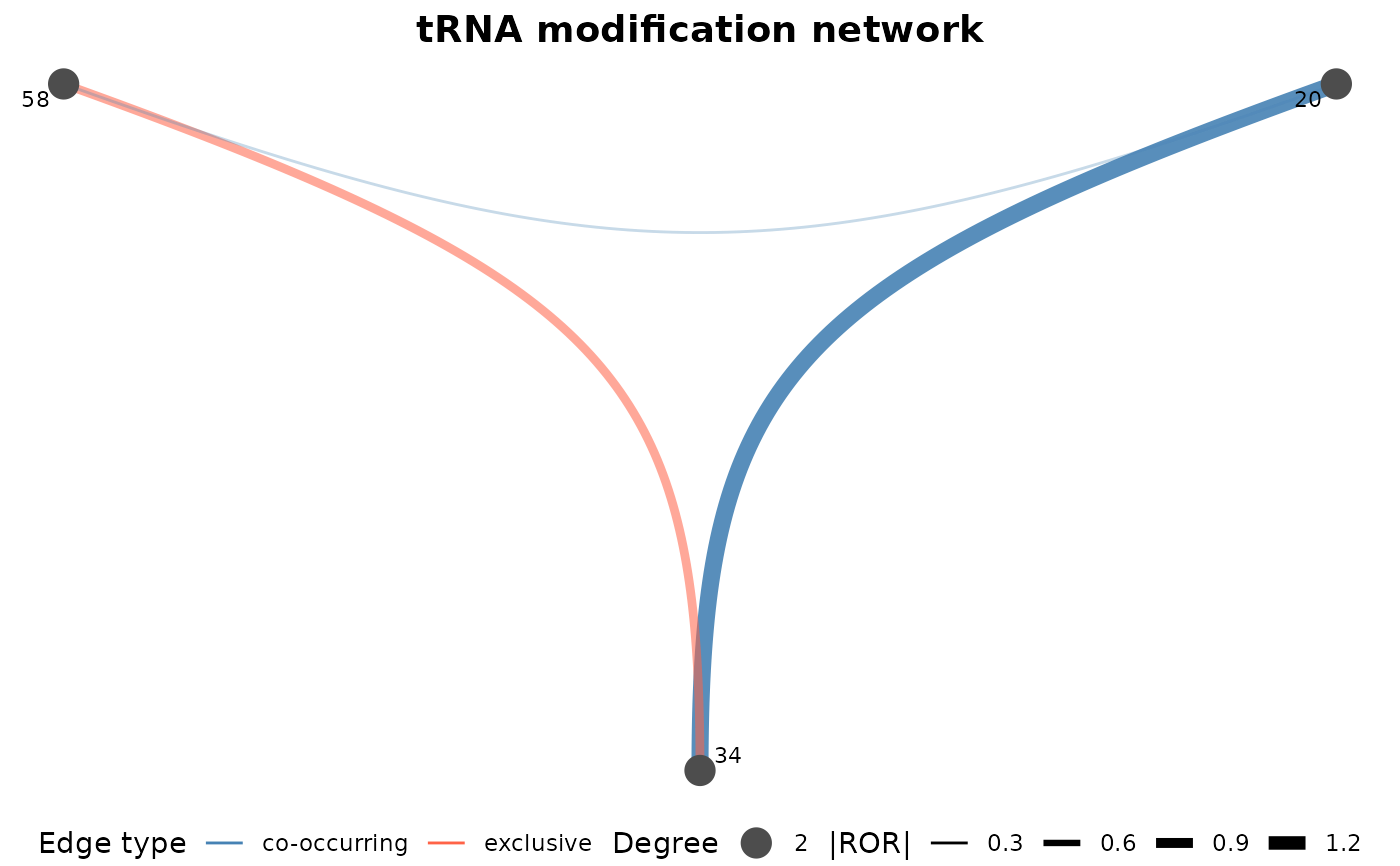
title = "tRNA modification network",
co_color = "steelblue",
ex_color = "tomato"
)Arguments
- graph
A
tbl_graphobject frombuild_or_network().- title
Plot title. Default
"tRNA modification network".- co_color
Color for co-occurring edges. Default
"steelblue".- ex_color
Color for exclusive edges. Default
"tomato".
Examples
# \donttest{
if (requireNamespace("ggraph", quietly = TRUE)) {
  df <- tibble::tibble(
    pos1 = c("20", "34", "20"),
    pos2 = c("34", "58", "58"),
    ror = c(1.5, -0.8, 0.3)
  )
  graph <- build_or_network(df)
  plot_arc_diagram(graph)
}

# }
# }