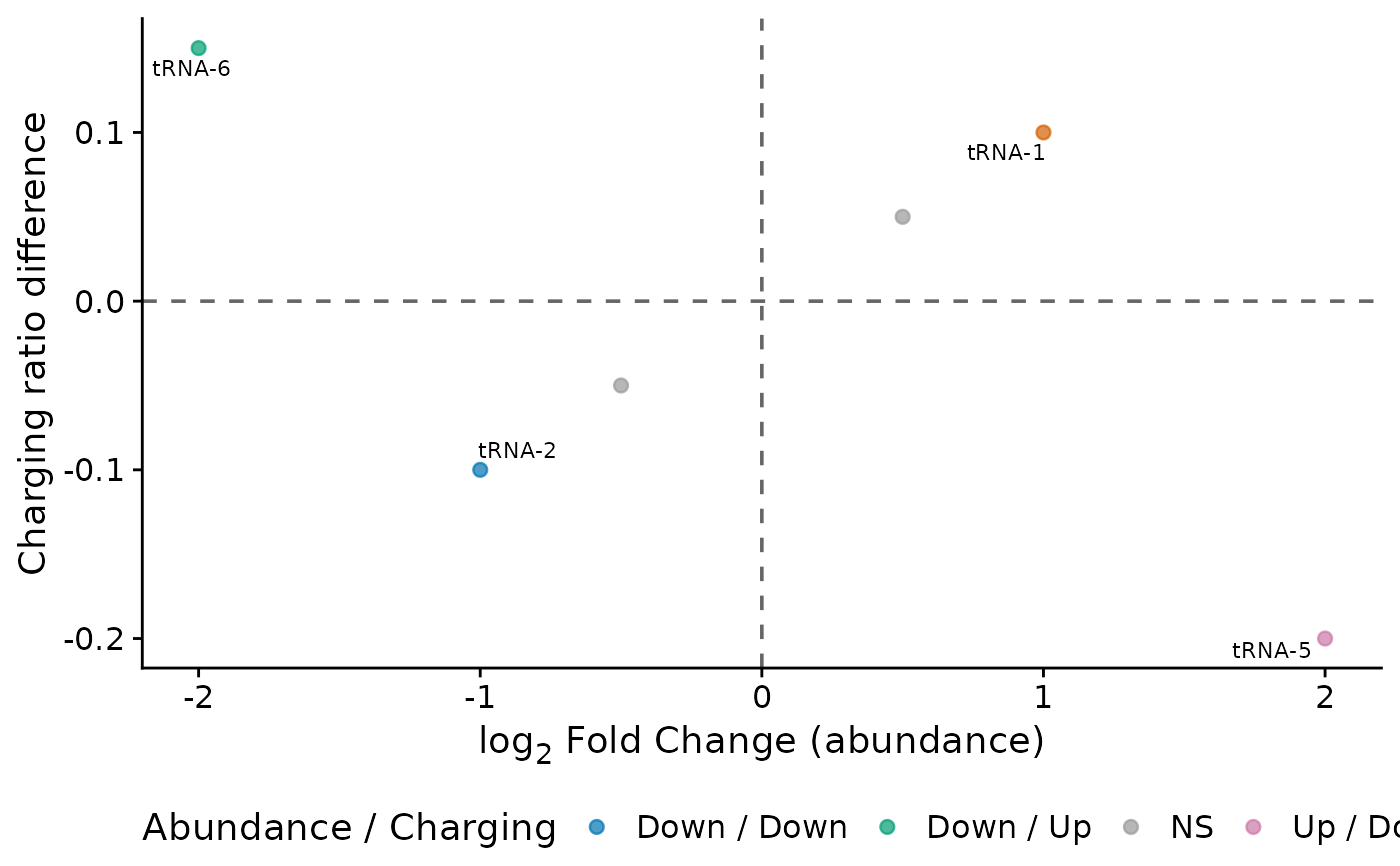
Creates a scatter plot comparing tRNA abundance changes (from DESeq2)
with charging ratio changes on a single plot. Significant points are
colored by quadrant and labeled with
ggrepel::geom_text_repel().
Usage
plot_abundance_charging(
  deseq_res,
  charging_diffs,
  lab_col = "ref",
  padj_cutoff = 0.05,
  max_overlaps = 20,
  point_size = 2,
  label_size = 3,
  shorten = TRUE,
  source_col = NULL,
  error_bars = TRUE
)
Arguments
- deseq_res
A tibble from
tidy_deseq_results()with at leastref,log2FoldChange, andpadjcolumns. Whenerror_barsisTRUE, anlfcSEcolumn is also expected.- charging_diffs
A tibble from
compute_charging_diffs()with at leastrefanddiffcolumns.- lab_col
Column name (string) used for point labels. Default
"ref".- padj_cutoff
Numeric; significance threshold for
padj. Default0.05.- max_overlaps
Maximum number of overlapping labels passed to
ggrepel::geom_text_repel(). Default20.- point_size
Numeric size for
ggplot2::geom_point(). Default2.- label_size
Numeric size for
ggrepel::geom_text_repel(). Default3.- shorten
Logical; if
TRUE(default), shorten tRNA names in point labels viashorten_trna_names().- source_col
Optional column name (string) for faceting, e.g.,
"source"to separate host and phage tRNAs. When provided, the column must exist indeseq_res. DefaultNULL.- error_bars
Logical; if
TRUE(default), draw horizontal error bars (lfcSE) on significant points. Requires anlfcSEcolumn indeseq_res.
Examples
deseq_res <- tibble::tibble(
  ref = paste0("tRNA-", 1:6),
  log2FoldChange = c(1, -1, 0.5, -0.5, 2, -2),
  padj = c(0.01, 0.02, 0.5, 0.6, 0.001, 0.003)
)
charging_diffs <- tibble::tibble(
  ref = paste0("tRNA-", 1:6),
  diff = c(0.1, -0.1, 0.05, -0.05, -0.2, 0.15),
  se_diff = rep(0.03, 6)
)
plot_abundance_charging(deseq_res, charging_diffs)