This Rmarkdown document contains a series of exercises related to some R programming concepts that will be used in the workshop. After writing and executing your code please try to knit the Rmarkdown using the Knit button. We will review the answers to these questions in the pre-workshop class on Monday.
Please download the raw Rmarkdown from github to complete these exercises
- We will be using many R packages in the course. Please load all of the following packages to ensure that you have the packages used in the course installed.
If you run into issues, please follow the instructions provided in the R package installation post, contact the instructors via email (rbi.fellows@cuanschutz.edu) and/or post to the slack channel for help.
library(Seurat)
library(scran)
library(SingleCellExperiment)
library(tidyverse)
library(scDblFinder)
library(ComplexHeatmap)
library(limma)
library(clustifyr)
library(slingshot)
library(tradeSeq)
library(cowplot)
library(scales)
library(gridExtra)
library(ComplexHeatmap)
library(destiny)
library(knitr)
library(LaCroixColoR)
library(viridis)
library(RColorBrewer)
library(harmony)
library(ggridges)
library(pheatmap)
library(clusterExperiment)
mtcarsis a built-in dataset that is always loaded when R is started. The data.frame contains information on various vehicles (run?mtcarsin the console for a description via the help tab). Please print the first 5 rows of the data.frame
# answer here
- Assign the
mtcarsdataset to a new variable. Name the variable whatever you would like. Please print the first 5 rows of the new data.frame.
# answer here
- Select the
mpgcolumn from themtcarsdata.frame and print the first 5 values of this vector ofmpgvalues.
# answer here
- What type is the mpg vector (logical, character, integer, numeric, factor) ?
# answer here
- Using the code below, add the
new_infovector to themtcarsdata.frame so that it is now the last column in your data.frame. Print the first 5 rows of the new data.frame. Assign the data.frame to a new variable if you would like but it is not necessary.
new_info <- 1:nrow(mtcars)
# answer here
- Using the code below, subset the
example_matrixto a smaller matrix containing only rows 5 through 10 and columns 2 through 4.
example_matrix <- matrix(1:50, nrow = 10, ncol = 5)
- The pipe operator (
%>%) is a frequently used shortcut in the tidyverse. The pipe operator allows you to pipe data from one command to the next. See the documentation for some examples.
Please use the pipe operator to pipe the mtcars data.frame to the head() command
# answer here
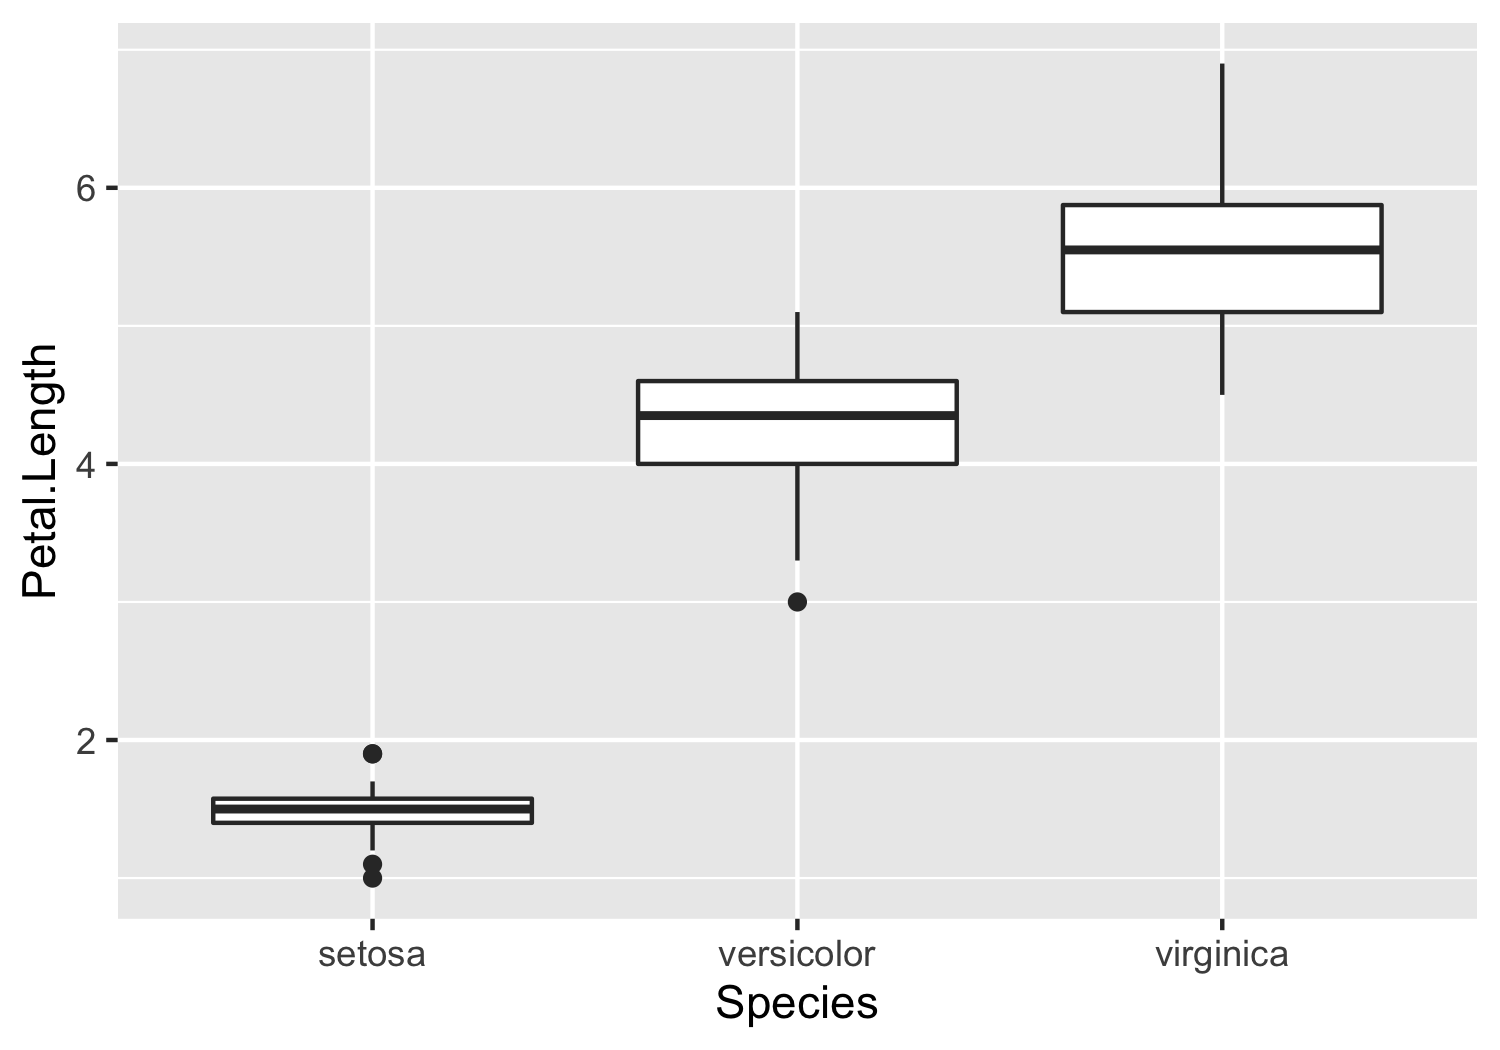
- Another builtin dataset in R is called
iriswhich contains information about various iris species. (run?irisin the console for a description via the help tab). Please useggplot(part of the tidyverse) to generate a boxplot comparing thePetal.Lengthacross different species. Your plot should look similar to the plot shown below.
knitr::include_graphics("example_plot.png")
# answer here
- Most computing systems have a concept of a working directory, which is the directory (e.g.
/path/to/class/dir/) where the R process (or other language) is currently associated. This is important because when specifying paths to files (e.g./path/to/class/dir/class2/class2.Rmd), the R process will interpret the path relative to the current working directory. For example if your working directory is/path/to/class/dir/class2then you can specifyclass2.Rmdrather than/path/to/class/dir/class2/class2.Rmdto refer to the file.
In Rstudio there is a difference between the working directory of the RMarkdown and the working directory of the console. The working directory of the Rmarkdown will always be the same directory where the R markdown is placed. In contrast the working direcotry of the console will in general be the same as the Rstudio project directory where the .Rproj file is placed. If you are note working in a project, then it will default to your home directory (e.g. /Users/username/ in macOs). We recommend setting up an individual project for each analysis project, or in this class, for each class.
To illustrate please run the following in the R markdown (e.g. hit the green play button).
getwd()
Next type and run the getwd() command in the console. What do you notice?
In general it is good practice to set the console working directory to the same directory as the Rmarkdown. This reduces confusion and makes it easier to run commands interactively.
Please use the setwd() function to set the working directory of the console to the same as the Rmarkdown. You’ll know this is successful because the path shown beneath the Console tab will be the same as the Rmarkdown path returned by running getwd() in the Rmarkdown.
- R packages generally have extensive documentation to explain the purpose of each function and how to execute each function. The documentation can be queried using the
Helptab. Alternatively you can use the?operator to pull up the documentation for specific functions. (e.g.?sum). Most functions will describe the arguments for the function and provide example code at the bottom of the documentation that can be copied and run in the console (or R markdown).
One of the main packages that we will be using for single cell analysis is Seurat. We will use the built-in documentation to teach use how to run a command. First load the Seurat package, then examine the documentation for VlnPlot. Copy the code from one of the examples in the documentation and run in the rmarkdown chunk below.
Google can also be used to find documentation online for functions (e.g. search for Seurat VlnPlot).
# answer here