This geom is similar to ggplot2::geom_point(), but also includes the
ability to outline points of interest. geom_point_trace() accepts
normal ggplot2 graphical parameters with some modifications. fill
controls the color of each point, color controls the outline
color, and stroke controls outline width, similar to how filled
shapes are modified for other ggplot2 geoms. Additional parameters including
size, linetype, and alpha are also accepted.
Usage
geom_point_trace(
  mapping = NULL,
  data = NULL,
  stat = "identity",
  position = "identity",
  ...,
  trace_position = "all",
  background_params = list(color = NA),
  na.rm = FALSE,
  show.legend = NA,
  inherit.aes = TRUE
)
Arguments
- mapping
Set of aesthetic mappings created by
aes()oraes_(). If specified andinherit.aes = TRUE(the default), it is combined with the default mapping at the top level of the plot. You must supplymappingif there is no plot mapping.- data
The data to be displayed in this layer. There are three options:
If
NULL, the default, the data is inherited from the plot data as specified in the call toggplot().A
data.frame, or other object, will override the plot data. All objects will be fortified to produce a data frame. Seefortify()for which variables will be created.A
functionwill be called with a single argument, the plot data. The return value must be adata.frame, and will be used as the layer data. Afunctioncan be created from aformula(e.g.~ head(.x, 10)).- stat
The statistical transformation to use on the data for this layer, as a string.
- position
Position adjustment, either as a string, or the result of a call to a position adjustment function.
- ...
Other arguments passed on to
layer(). These are often aesthetics, used to set an aesthetic to a fixed value, likecolour = "red"orsize = 3. They may also be parameters to the paired geom/stat.- trace_position
Specifies which data points to outline, can be one of:
"all" to outline every group plotted
"bottom" to only outline the bottom layer of data points
A predicate specifying which data points to outline. This must evaluate to
TRUEorFALSEwithin the context of the input data. e.g.value > 100
- background_params
Named list specifying aesthetic parameters to use for background data points when a predicate is passed to
trace_position, e.g.list(color = "red")- na.rm
If
FALSE, the default, missing values are removed with a warning. IfTRUE, missing values are silently removed.- show.legend
logical. Should this layer be included in the legends?
NA, the default, includes if any aesthetics are mapped.FALSEnever includes, andTRUEalways includes. It can also be a named logical vector to finely select the aesthetics to display.- inherit.aes
If
FALSE, overrides the default aesthetics, rather than combining with them. This is most useful for helper functions that define both data and aesthetics and shouldn't inherit behaviour from the default plot specification, e.g.borders().
Aesthetics
geom_point_trace() understands the following aesthetics (required aesthetics are in bold):
xyalphacolourfillgrouplinetypeshapesizestroke
Learn more about setting these aesthetics in vignette("ggplot2-specs").
Examples
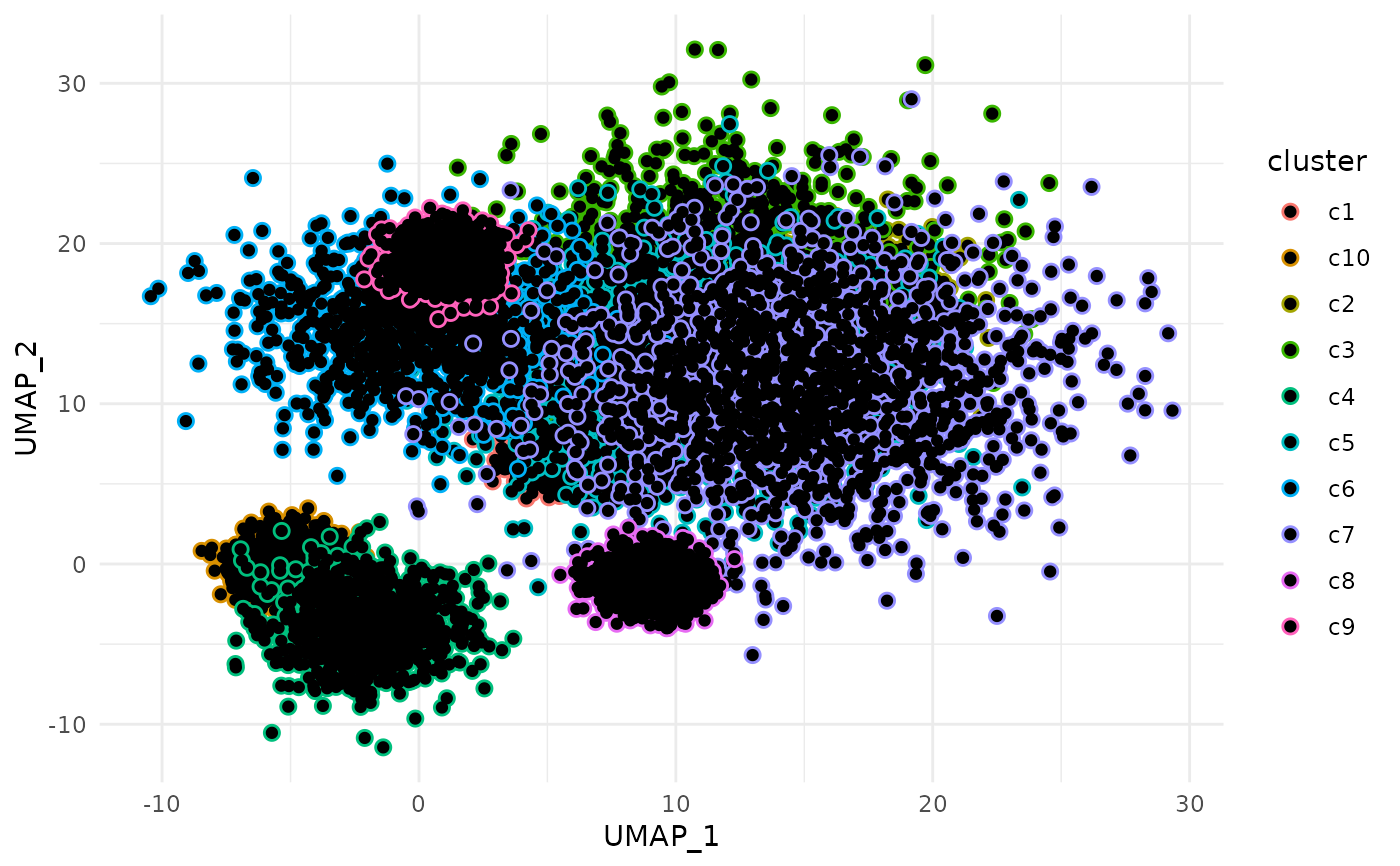
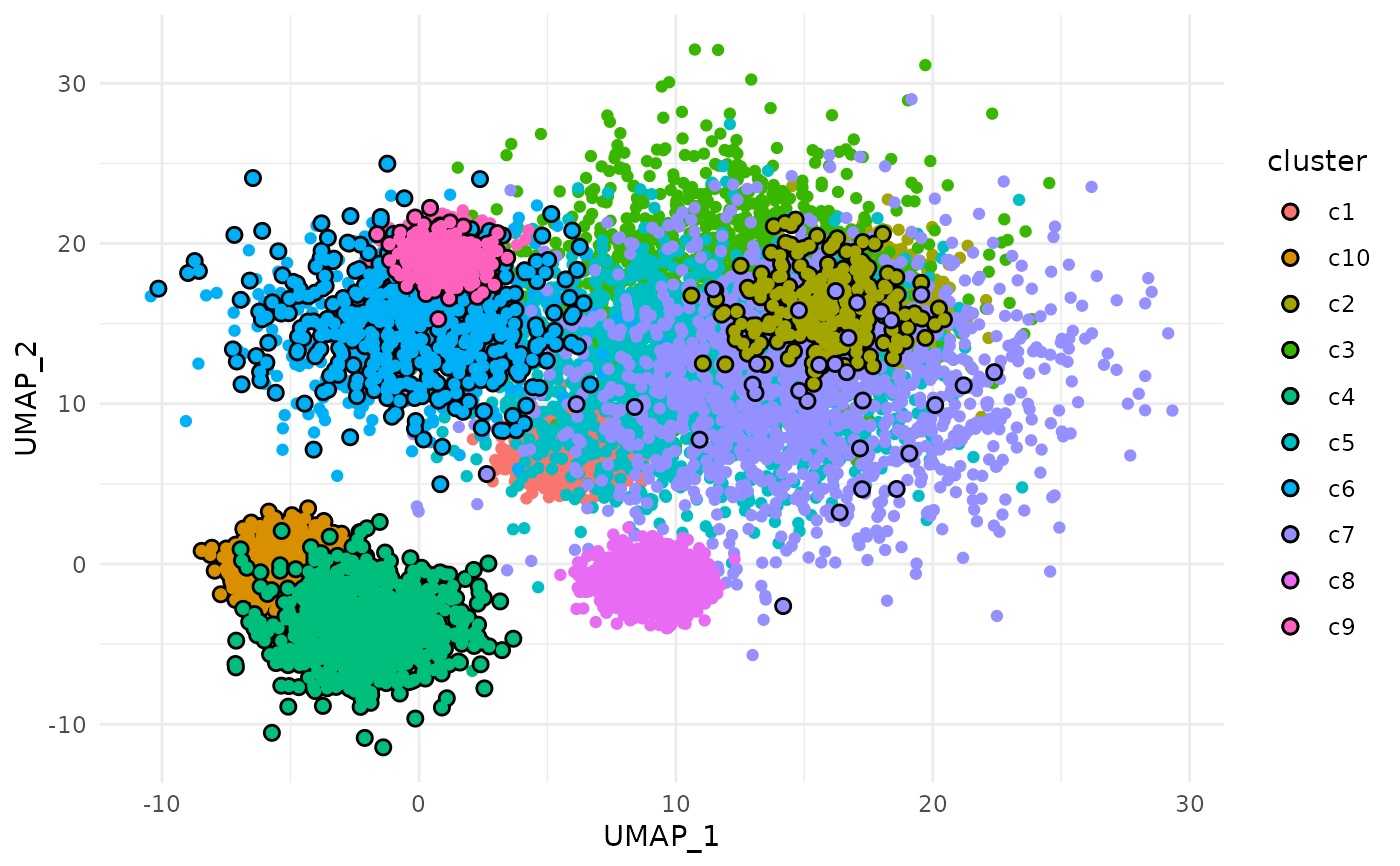
# Modify outline color for each group
ggplot2::ggplot(
clusters,
ggplot2::aes(UMAP_1, UMAP_2, color = cluster)
) +
geom_point_trace() +
ggplot2::theme_minimal()
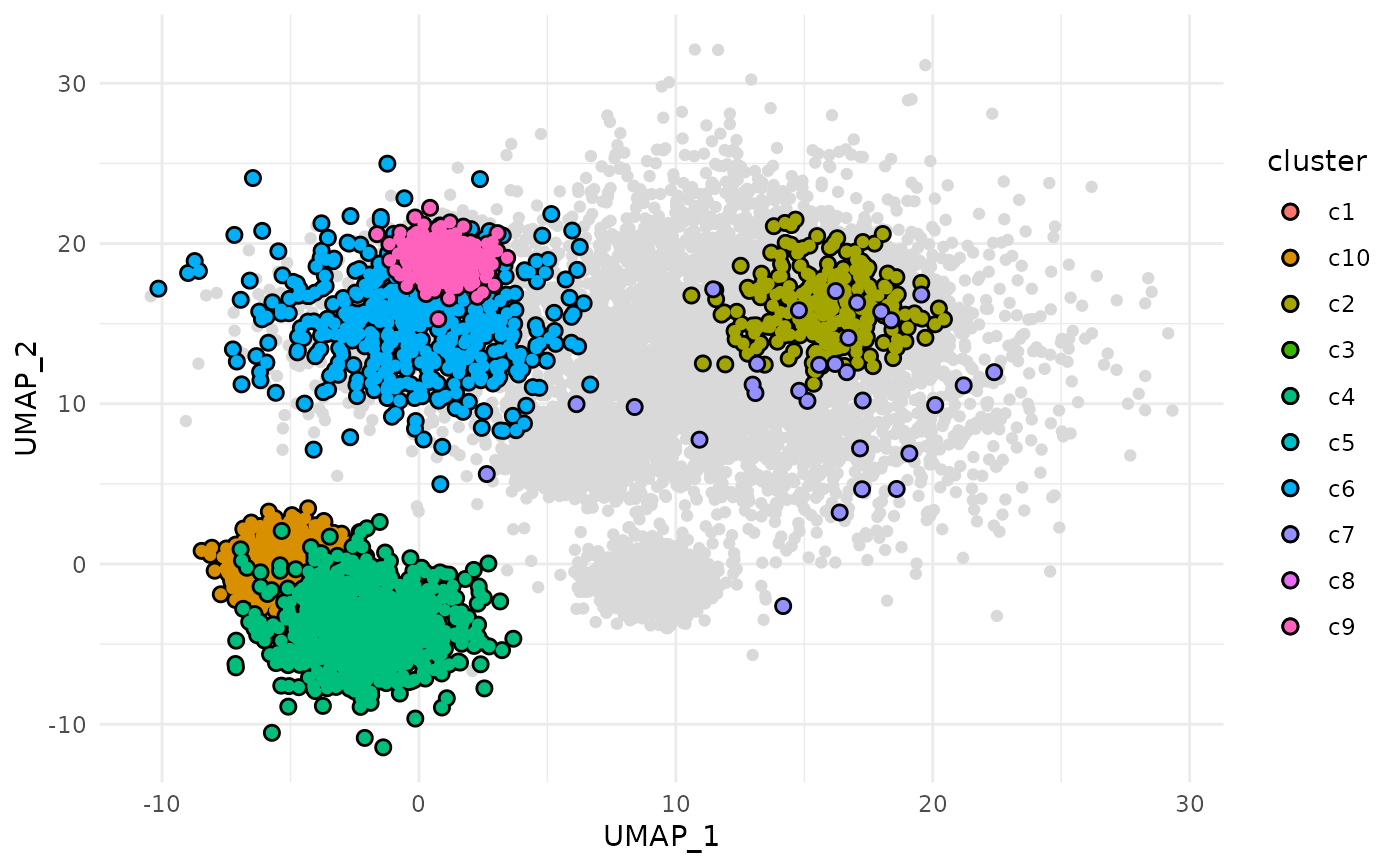
 # Outline a subset of points
ggplot2::ggplot(
clusters,
ggplot2::aes(UMAP_1, UMAP_2, fill = cluster)
) +
geom_point_trace(trace_position = signal < 0 | signal > 17) +
ggplot2::theme_minimal()
# Outline a subset of points
ggplot2::ggplot(
clusters,
ggplot2::aes(UMAP_1, UMAP_2, fill = cluster)
) +
geom_point_trace(trace_position = signal < 0 | signal > 17) +
ggplot2::theme_minimal()
 # Modify appearance of background points
ggplot2::ggplot(
clusters,
ggplot2::aes(UMAP_1, UMAP_2, fill = cluster)
) +
geom_point_trace(
trace_position = signal < 0 | signal > 17,
background_params = list(color = NA, fill = "grey85")
) +
ggplot2::theme_minimal()
# Modify appearance of background points
ggplot2::ggplot(
clusters,
ggplot2::aes(UMAP_1, UMAP_2, fill = cluster)
) +
geom_point_trace(
trace_position = signal < 0 | signal > 17,
background_params = list(color = NA, fill = "grey85")
) +
ggplot2::theme_minimal()